
What Is LCP And Why It Matters: Unlock Instant Page Experiences - Part 1
Table of Contents
Part 1 of 2 in our What is LCP and Why it matters series
- What Is LCP And Why It Matters: Unlock Instant Page Experiences - Part 1
- What Is LCP And Why It Matters: Unlock Instant Page Experiences - Part 2

Let’s be real, nobody likes waiting for a website to load. In our dopamine‑driven world, we’ve become conditioned to expect instant gratification. Tap a link, and if you don’t see meaningful content appearing a few seconds later, you’re already reaching for the back button. That’s exactly why Largest Contentful Paint (LCP) is such a big deal. Google included it in the Core Web Vitals because it measures how fast users perceive your site to load - and perception in today’s rapid‑fire attention economy really is everything.
This post is the first in a two-part series dedicated to understanding and optimizing LCP. The first part covers the theoretical concepts of LCP, explores its significance through real-world data and case studies, and dissects the factors that influence its performance. In Part 2 of this series, we’ll move from theory to practice, providing a walkthrough of how a performance engineer systematically approaches LCP improvements in a real-world lab environment.
TL;DR
Largest Contentful Paint (LCP) is a crucial Core Web Vital that measures how quickly the main content of your webpage becomes visible to users. A "good" LCP score is 2.5 seconds or less, reflecting a user's perception of a fast-loading site. This metric is more than just technical - it directly impacts user experience, engagement, and ultimately, business metrics like conversions and revenue.
LCP is a "moving target," updating as larger elements load, with the final value recorded when the largest contentful element is fully rendered or the user interacts with the page.
Optimizing LCP involves addressing four key phases:
Time to First Byte (TTFB): Improve server response times through caching and CDN usage.
Resource Load Delay: Ensure the LCP element is discovered and loaded early, ideally using
preloadfetchpriority="high"Resource Load Duration: Optimize the size of the LCP resource, especially images, using proper compression and
srcsetElement Render Delay: Reduce render-blocking resources by optimizing JavaScript bundle sizes, code splitting, and lazy loading third-party scripts after LCP.
The CrUX report displays a consistent positive trend in LCP. However, many users still do not experience a "good" LCP.
Don’t "cheat" the LCP metric. Optimize genuinely to ensure accurate tracking of user experience.
To convince stakeholders to prioritize LCP, translate improvements into business terms, present real-world data, highlight SEO benefits, and demonstrate tangible user impact. Ultimately, a strong LCP leads to happier users, better engagement, and increased revenue.
LCP: More Than Just Another Metric
LCP measures the time it takes for the largest visible element on your page to render. In practical terms, that could be:
A hero image
A featured blog post image
A large heading or banner
A headline or description text
A background video
Why does it matter? The moment your largest element appears is when users feel your site is ‘ready’ for them. It’s easy to say ‘technical metrics keep developers happy,’ but in reality, the majority of metrics exist for a reason. Core Web Vitals, especially, are the best indicators of true user experience. For example, Time to First Byte (TTFB) ensures your backend responds quickly - but you can still deliver a blank screen if you focus only on TTFB. LCP fills that gap by tying load speed directly to what people actually see first, which is why LCP is a Core Web Vital.
A Faster Site = More Users Sticking Around
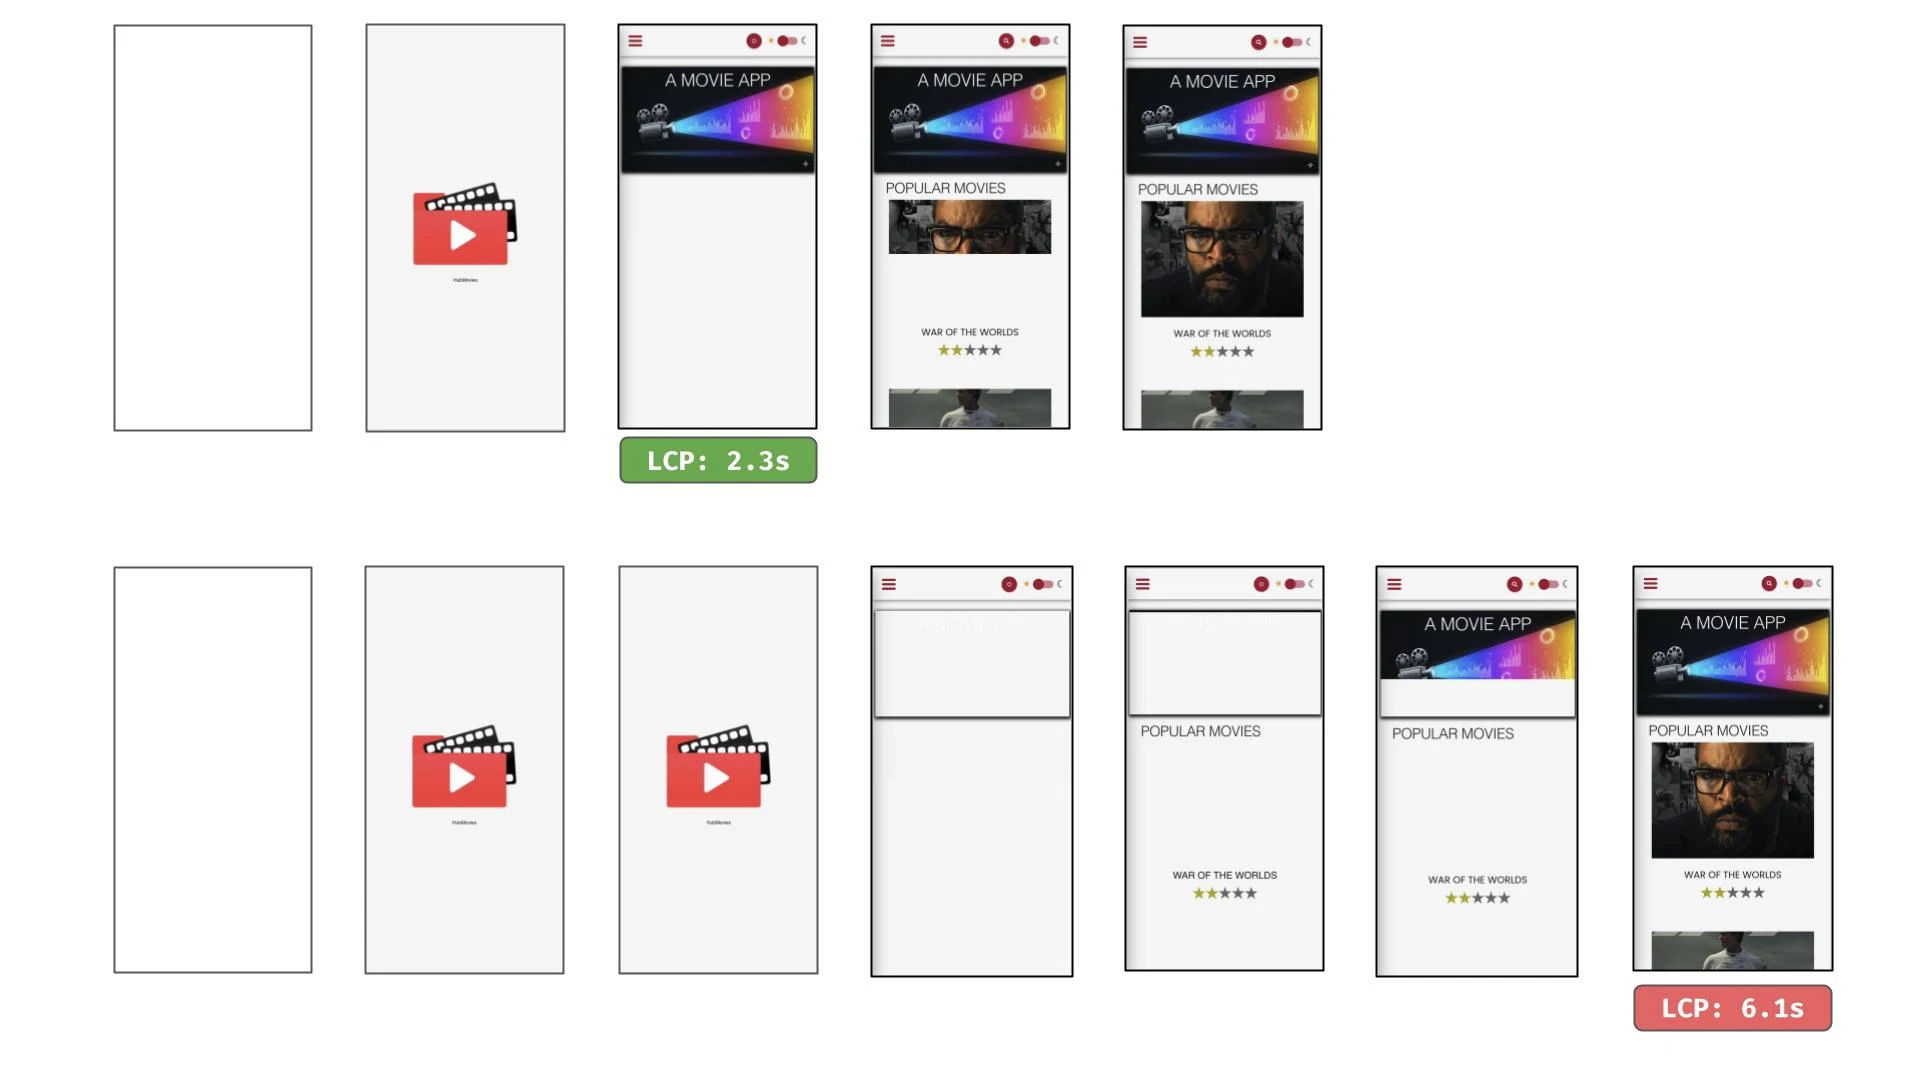
People love it when a website loads fast. Fast-loading websites create a smooth experience that builds trust and confidence in your brand, while slow-loading pages can feel outdated and unreliable.
Let’s talk business. Improving your LCP doesn’t just feel good, it boosts engagement and conversions. Studies have shown:
Companies that improved Core Web Vitals saw measurable lifts in user satisfaction and revenue.
Pinterest cut load time and saw sign‑ups jump by 15%.
Walmart reduced LCP by one second and gained a 2% conversion boost.
How LCP is scored

Like all Core Web Vitals, LCP is scored within three ranges.
A "good" LCP score is 2.5 seconds or less. Anything between 2.5 and 4.0 seconds is considered "needs improvement," and anything over 4.0 seconds is "poor." These scores are based on real-world user data from the Chrome User Experience Report (CrUX).
The 2.5-second LCP threshold was determined by Google using a combination of human perception research and analysis of real-world web data. It represents a balance between an ideal user experience and what is realistically achievable for a well-optimized website.
LCP is a “moving target”
When a page starts loading, the browser dispatches an initial LCP candidate as soon as it paints the first frame. This value is likely a small element, like a logo or a header. However, the browser continuously monitors the page for new elements and re-evaluates which one is the largest.
As larger content like a hero image or a main text block loads, the LCP value is updated to reflect the render time of this new largest element. This explains LCP being a moving target.
The final LCP value is reported when the largest contentful element is completely visible and has finished rendering. The browser stops looking for new candidates when the user interacts with the page (e.g., scrolls or taps a button) or when the page load is complete.

Factors That Influence LCP Stability
Several factors can cause LCP to jump from element to element, delaying the final, stable measurement:
Late-loading resources: If a large image or video poster is one of the last resources to load, the LCP value will be unstable until that element renders.
Dynamic content: Websites that use JavaScript to dynamically load content can have an LCP that changes as new, larger elements are injected into the DOM.
Web fonts: A large block of text may not be considered for LCP until its custom web font has finished loading and the text is rendered on the screen.
The LCP metric is a race to load the most important content on the page. The stable LCP value is the time at which the main content has reached the finish line.
The LCP Breakdown
LCP is divided into four stages that represent the time from when a user requests a page to when the largest element is fully visible.
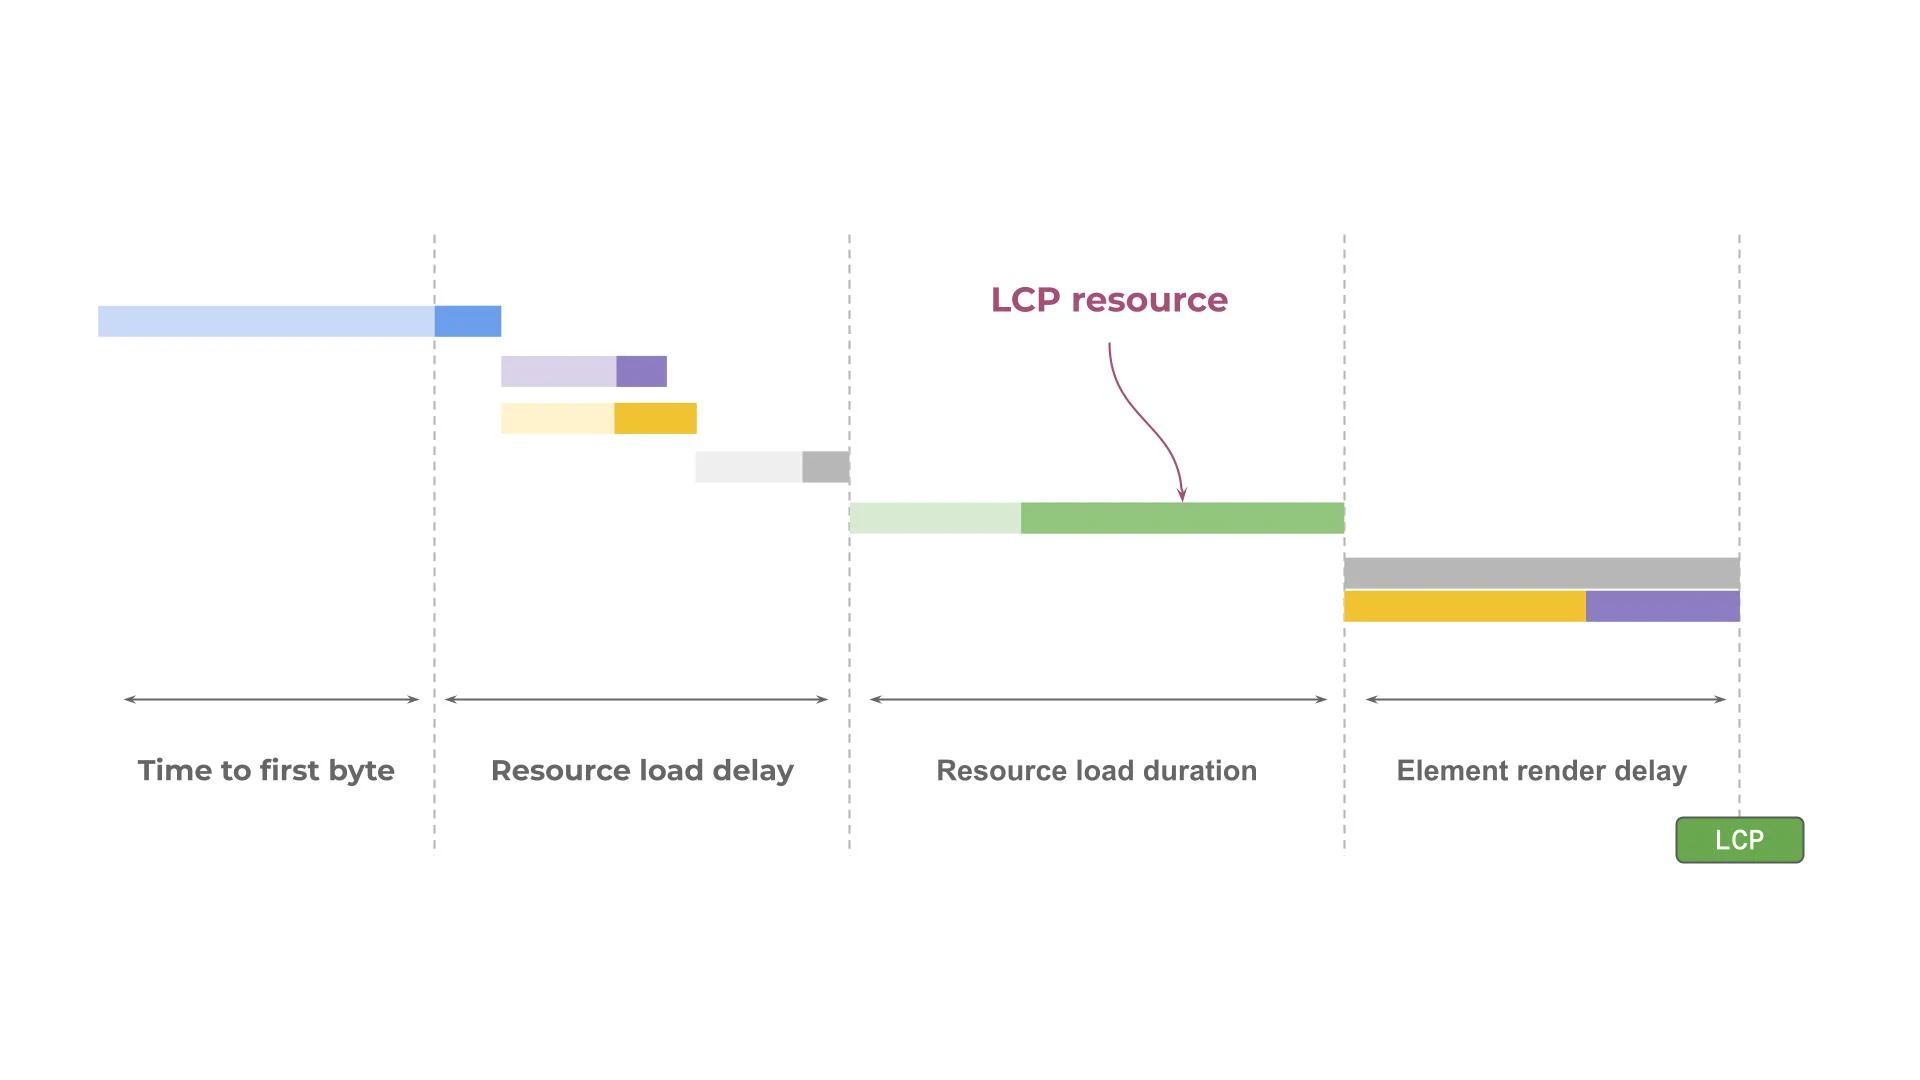
These four stages apply to every page and can neither overlap nor have a gap between them. Summed up, they result in the final LCP value being reported.
There is no silver bullet to improve LCP, knowing and understanding its different phases is crucial for an effective optimization process. Each application, environment, and user base presents unique challenges when it comes to enhancing LCP. Moreover, improvements in one area may inadvertently cause bottlenecks in another. Therefore, taking a strategic approach and validating progress through measurements is essential for achieving faster perceived page load times.
Let’s dive into each of the phases of LCP and discuss typical culprits, as well as optimization opportunities.
1. Time to First Byte (TTFB)
TTFB is the time it takes for a user's browser to receive the first byte of the page content after sending a request. This stage accounts for the server's response time, including any redirects and processing. A slow TTFB can indicate server-side issues, a lack of caching, or network latency.
If you see TTFB as a high contributor to your LCP, you most likely need to address this on the server, hosting, or infrastructure level.
Typical solutions are the use of caching & serving on the edge, close to the user.
2. Resource Load Delay
Resource load delay measures the time between the browser receiving the first byte of the HTML and when it starts to load the largest element's resource (e.g., an image file). A significant delay may occur before the browser can discover the LCP element, because it’s busy processing the critical CSS and JavaScript.
A late discovery means the LCP resource is not part of the initial document but is instead inserted lazily into the DOM. When you think about frontend frameworks like React or Angular, users first need to download the main framework chunks in order to render anything to the screen. For example, an image tag that is generated by a specific component won’t appear until the framework has loaded. This results in a waterfall-like chain to reach the LCP resource.
The goal should be to make the LCP resource discoverable as early as possible.
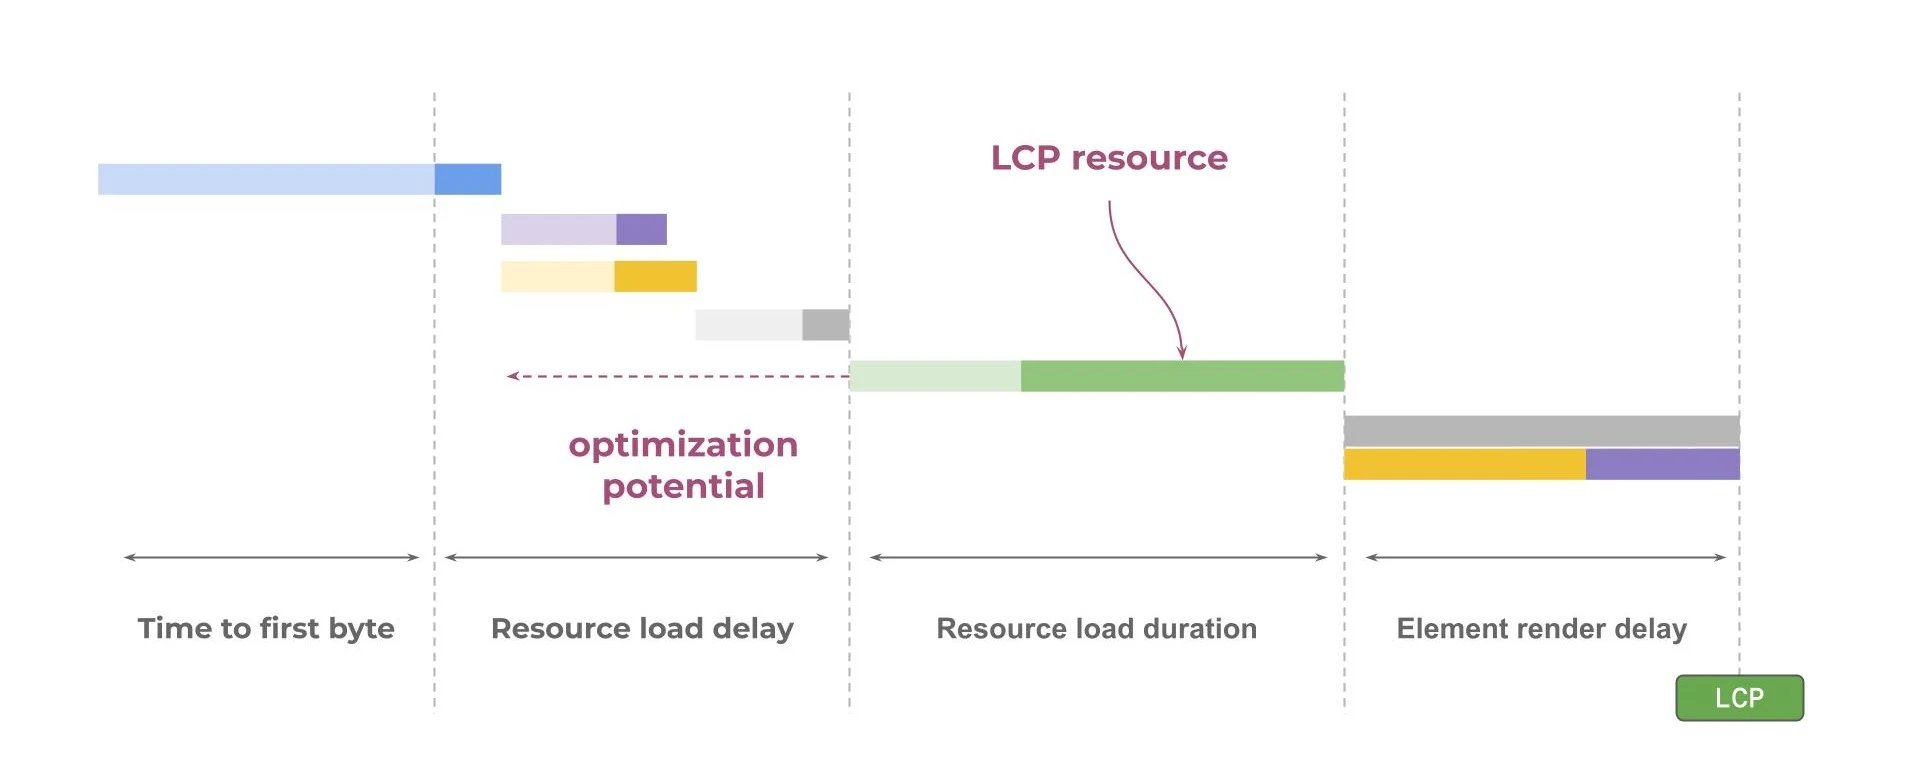
To improve resource load delay, you have a couple of options. In case your LCP resource is an image, you should make sure it’s eagerly loaded and has a high fetchpriority.

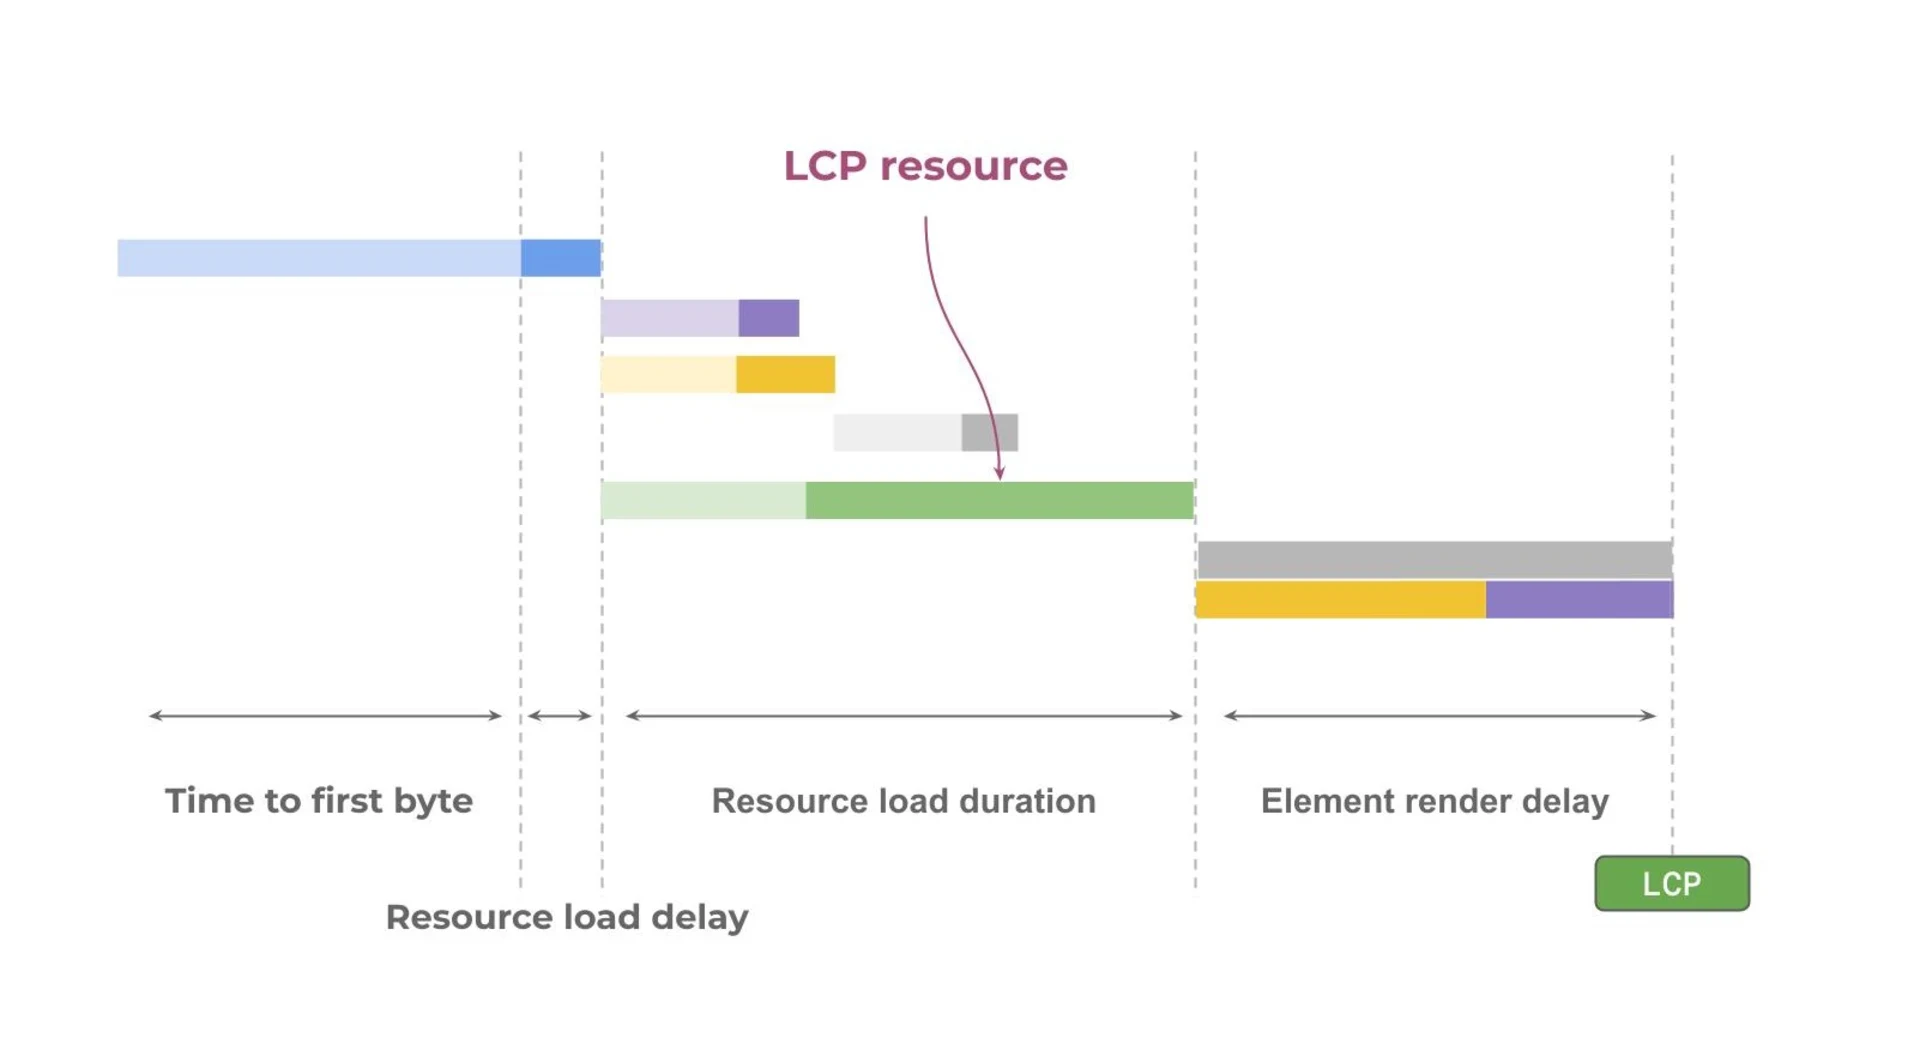
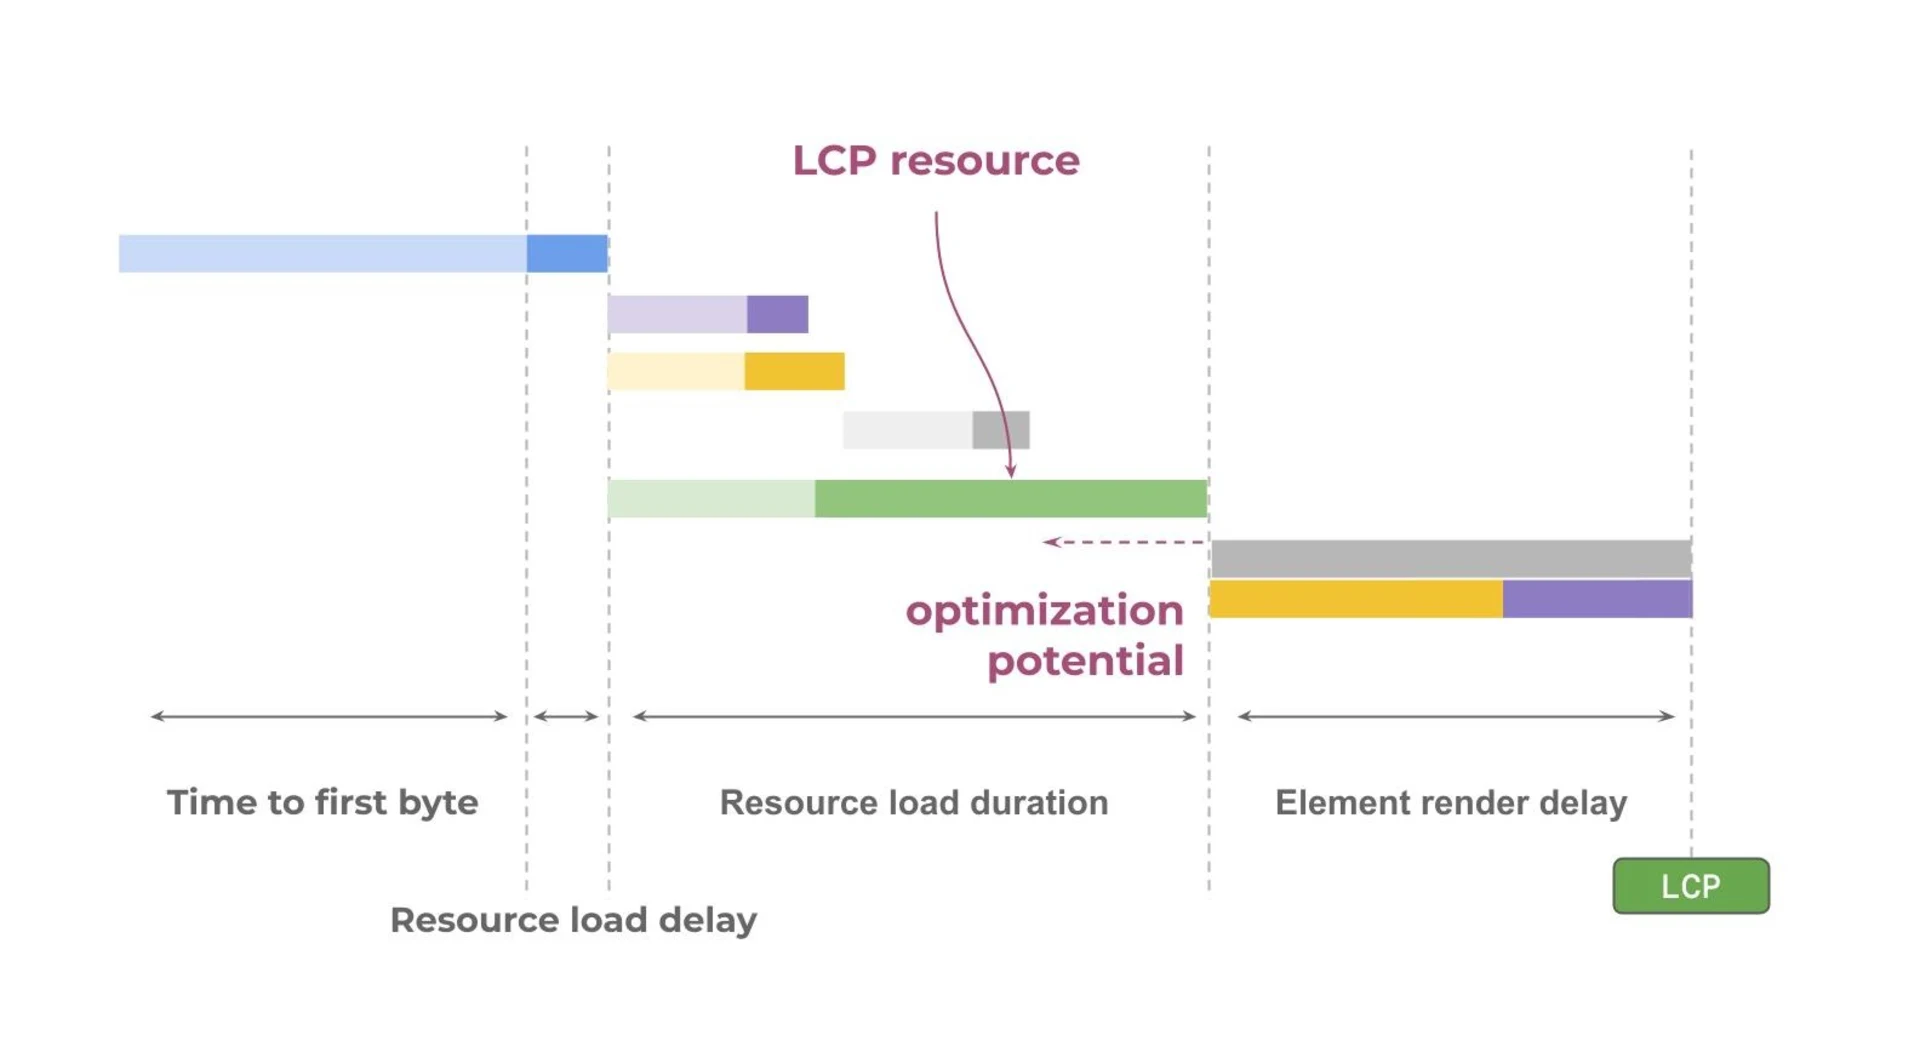
To achieve the best possible resource load delay you should use the `preload` resource hint, which tells the browser to start downloading the specified resource immediately when parsing the index html. If no other blocking resource prevents it being loaded, your resource load delay drops down to zero.
The following visualization explains the impact of image preloading. It essentially means to cut off the resource load delay entirely.
Other things to consider are the amount of JavaScript & CSS that must be processed before reaching the LCP resource. Reducing the bundle size and choosing the right compression algorithm for your assets is key.
Statically generated sites typically avoid bottlenecks in resource load delay, as their main resources are already inlined into the initial response. This is also true for frontend frameworks using any form of server side rendering (SSR).
3. Resource Load Duration
This is the time it takes for the LCP element's resource itself to download. Factors that affect this stage include the size of the resource (a large image takes longer to download), the user's connection speed, and whether the resource is being served from a CDN (Content Delivery Network).
To improve resource load duration, you should be aware of what type of resource you are fetching. This is especially important when dealing with images or videos.
Choosing the right compression & resolution for your images can significantly reduce the assets size, which also decreases the time it takes for the browser to download it.
Tools like squoosh help you to compress and optimize your assets to display on your web application.
To further stress the importance of downsizing assets, we can take a look at download times for images of different sizes.
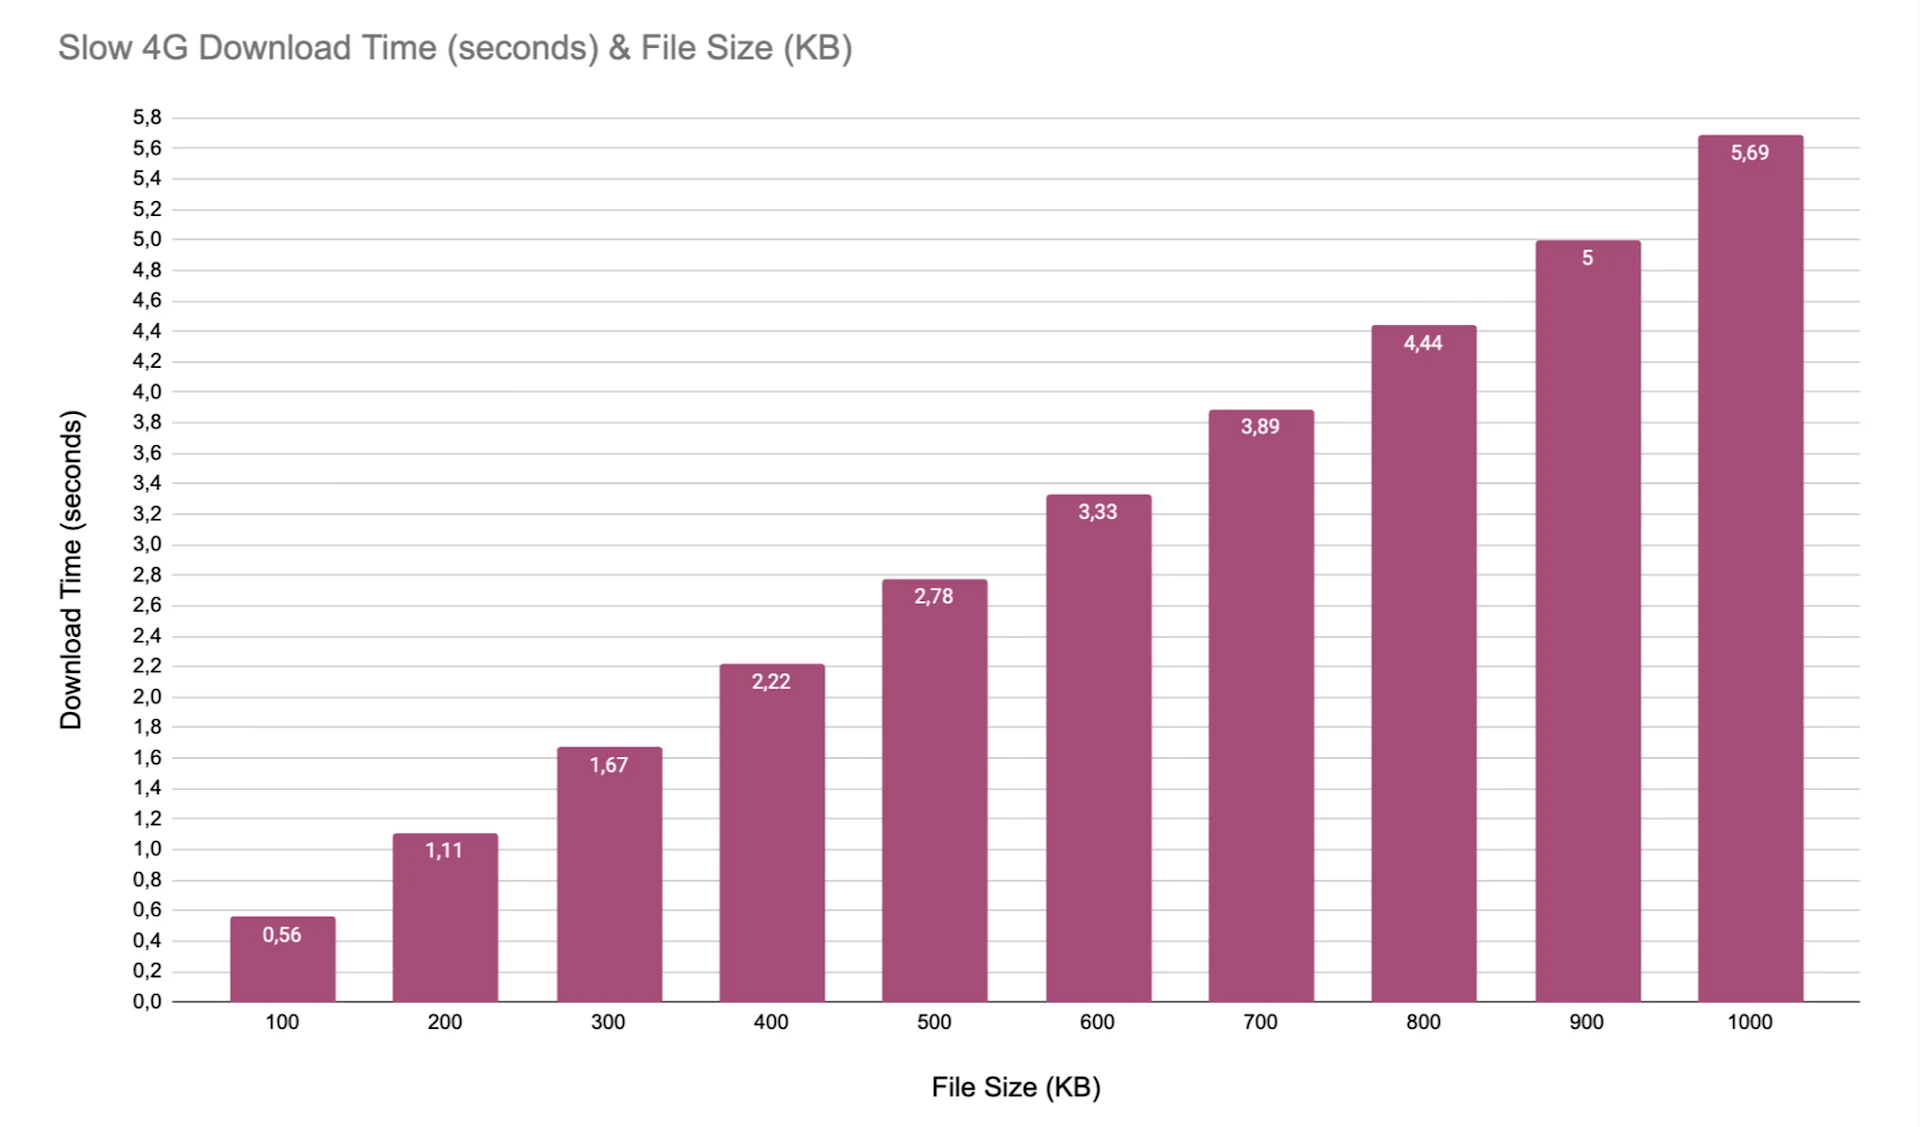
200KB doesn’t sound like much, but have you ever asked yourself what it means to download 200KB? As we are not trying to optimize for users who have optimal conditions, let’s examine the experience on a “Slow 4G” network, which is defined as 1.44 Mbps download speed in Chrome.
Downloading an image of 200KB in size on a slow connection takes around ~1.11 seconds. Remember this is only true when there is nothing else using your bandwidth, like downloading other page resources or your phone is doing background work.
The following table gives you an idea about download times for images from 100KB to 1MB on a “Slow 4G” network.
Downscaled assets might look sharp on low-mid tier devices or on small browser windows, but they tend to look pixelated to users with high-end devices.
The srcset property of images allows developers to specify image sources based on media conditions. This enables the browser to choose the most suitable asset for the user's device, optimizing the images according to the device's specifications.

The above code snippet makes the browser download a low-resolution image for screens with low resolution and a high-resolution image for high-resolution displays.
If configured correctly, you can validate it by resizing your screen and observing the network tab.
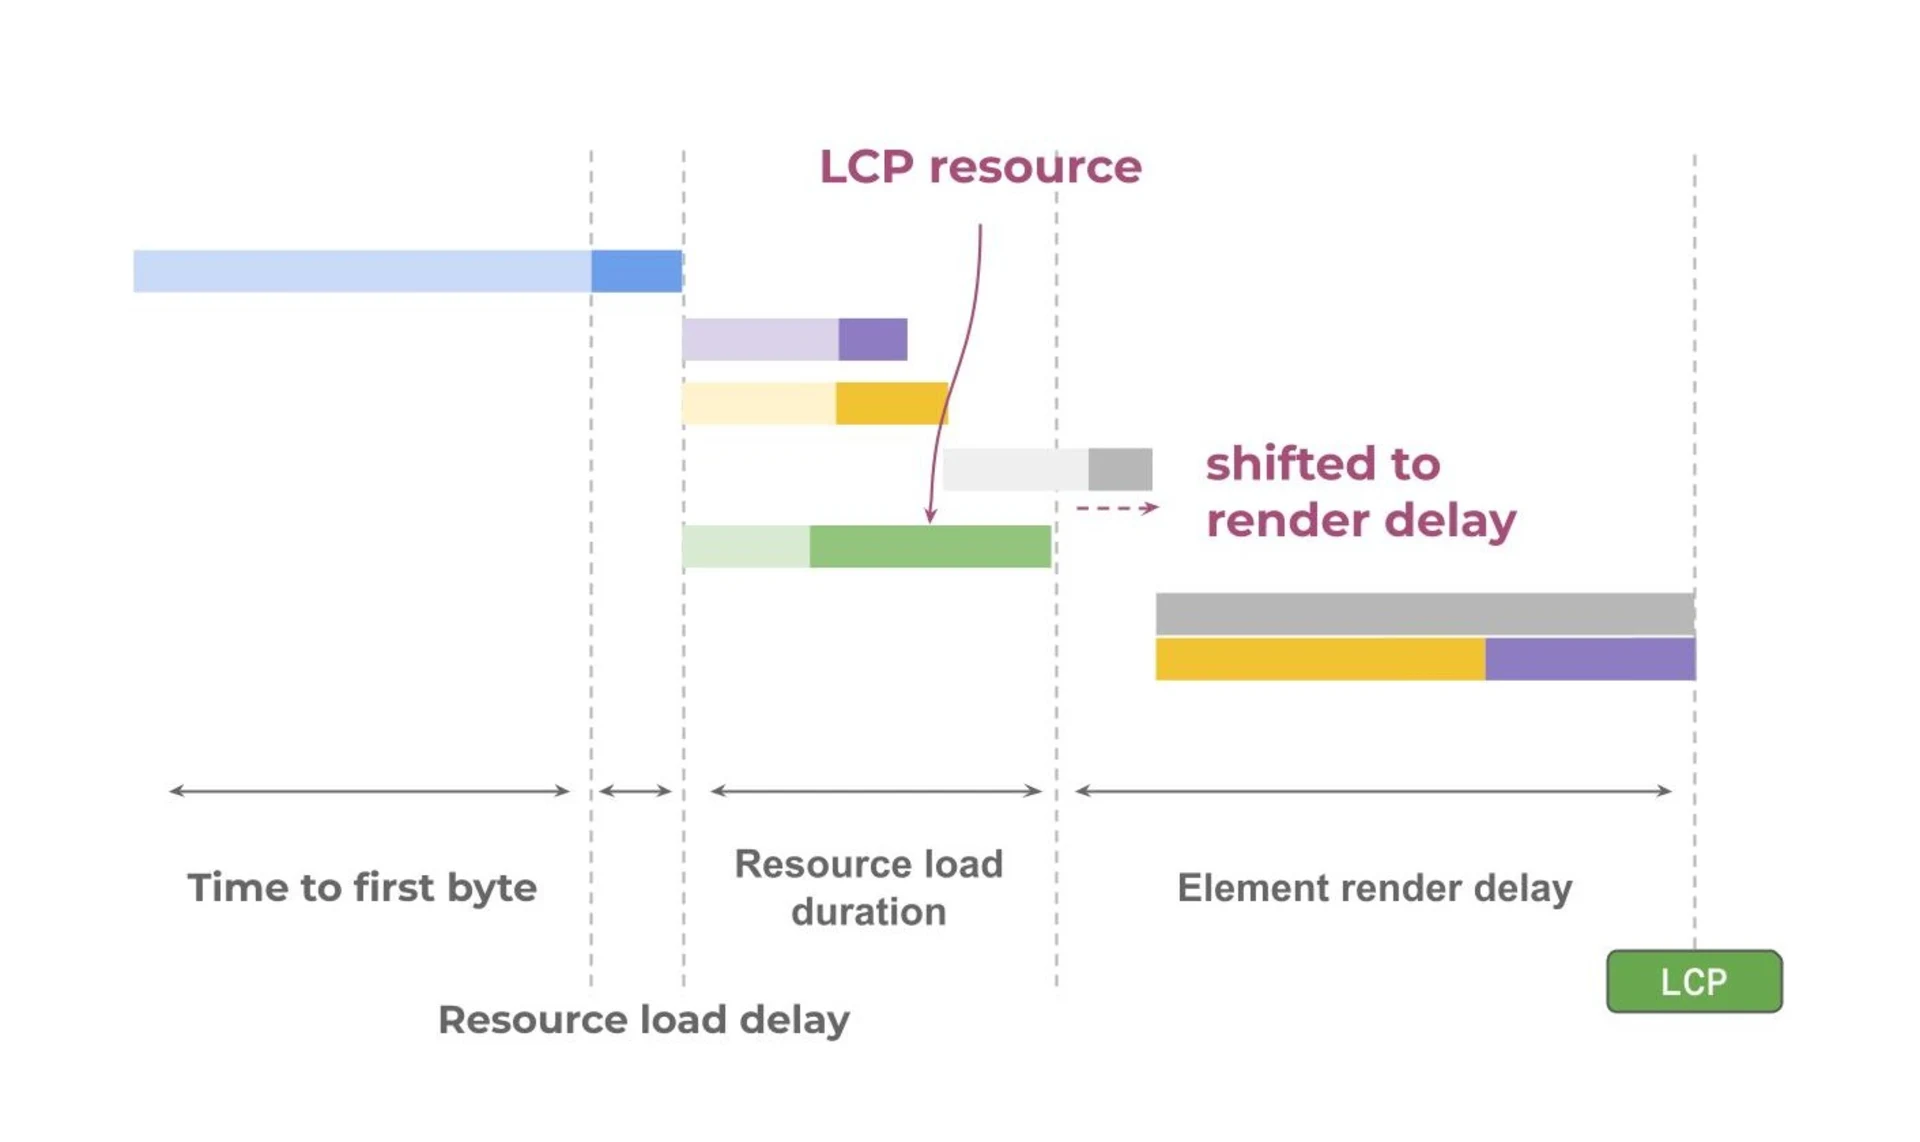
Let’s look at the potential outcome after improving the resource size. We clearly see that resource load duration improves. However, element render delay increases and becomes the new bottleneck.
4. Element Render Delay
Element render delay is the time between the LCP resource finishing its download and the element actually being painted on the screen. High element render delay occurs when the browser waits on other elements to load or JavaScript to process. It could be a stylesheet to download or a JavaScript framework that first needs to bootstrap before rendering the LCP element.
It varies a lot depending on what other improvements you’ve already made. If you have already optimized the resource load delay and resource load duration, the element render delay eventually becomes more prominent. This is also what we’ve seen in the example before.
Optimizing this stage involves ensuring render-blocking resources are loaded efficiently. Typical improvements involve making sure third-party scripts are not downloaded and executed before the LCP resource is rendered as well as fetching only the minimum amount of data necessary to display your LCP resource as early as possible.
The image below shows optimizations for minimizing render delays by reducing the amount of render-critical data fetched.
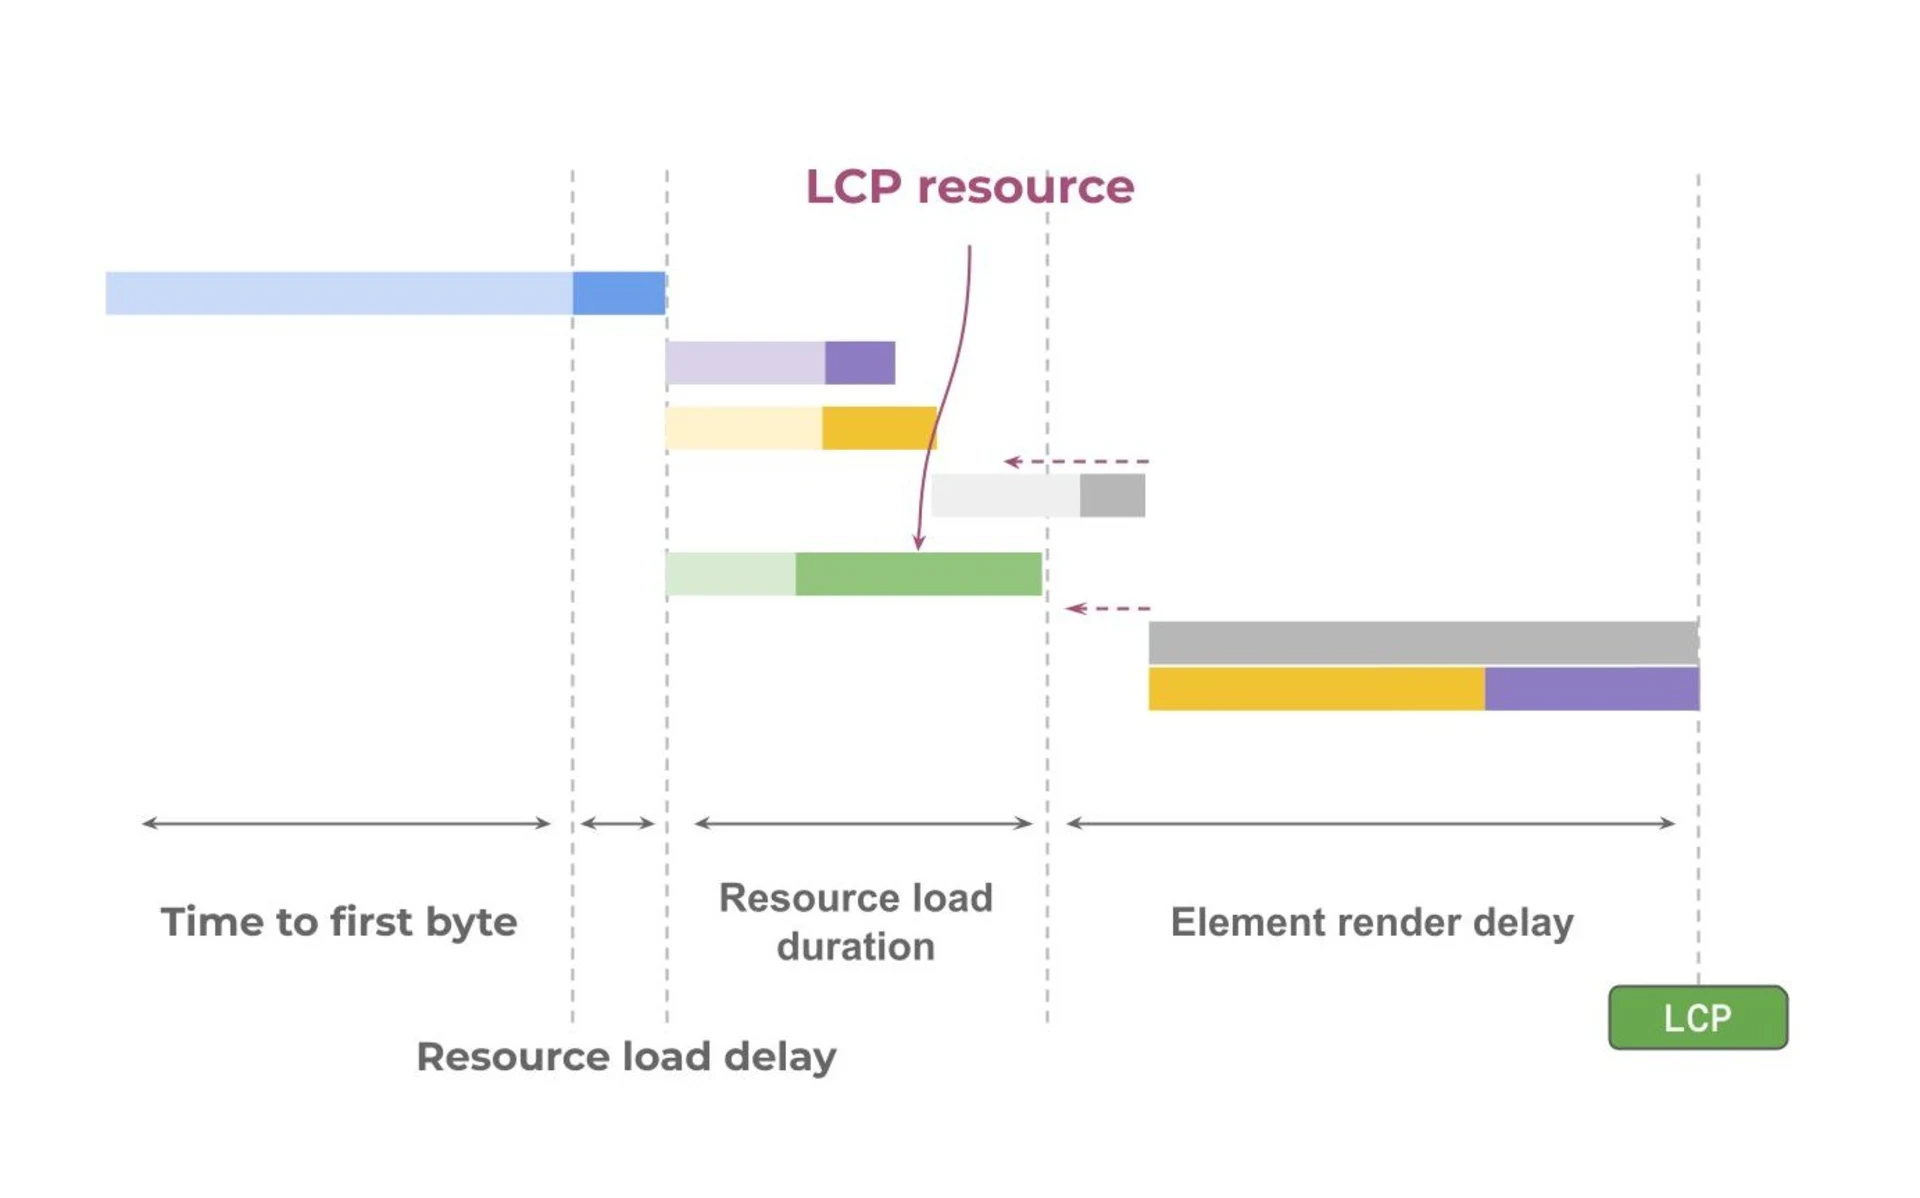
Other opportunities to improve element render delay include bundle size optimizations by introducing feature lazy loading and code splitting, having less DOM and CSS that needs to be parsed, and less JavaScript to be executed on the main-thread before the LCP resource can be displayed.
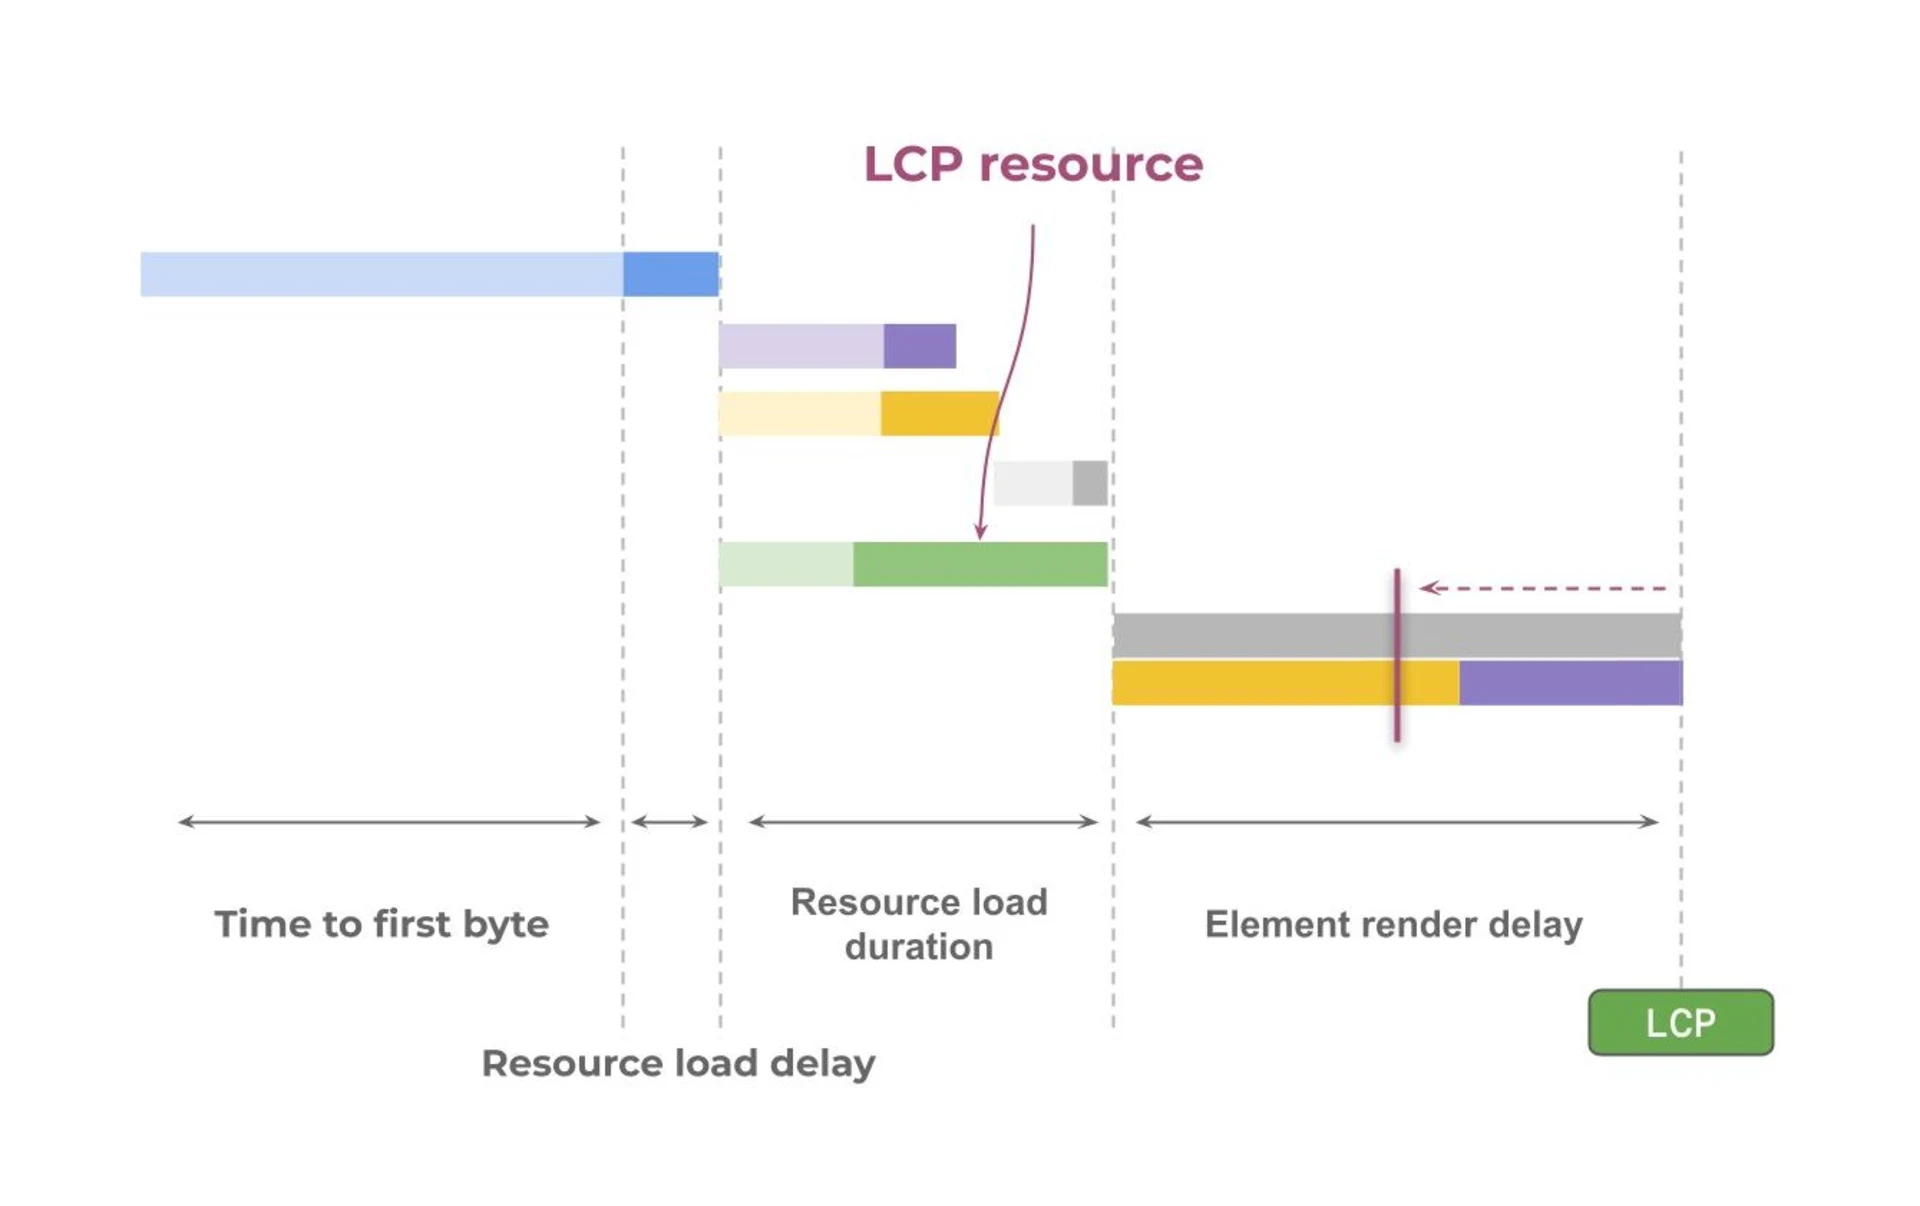
By also optimizing the main thread execution, we have reached the following outcome.
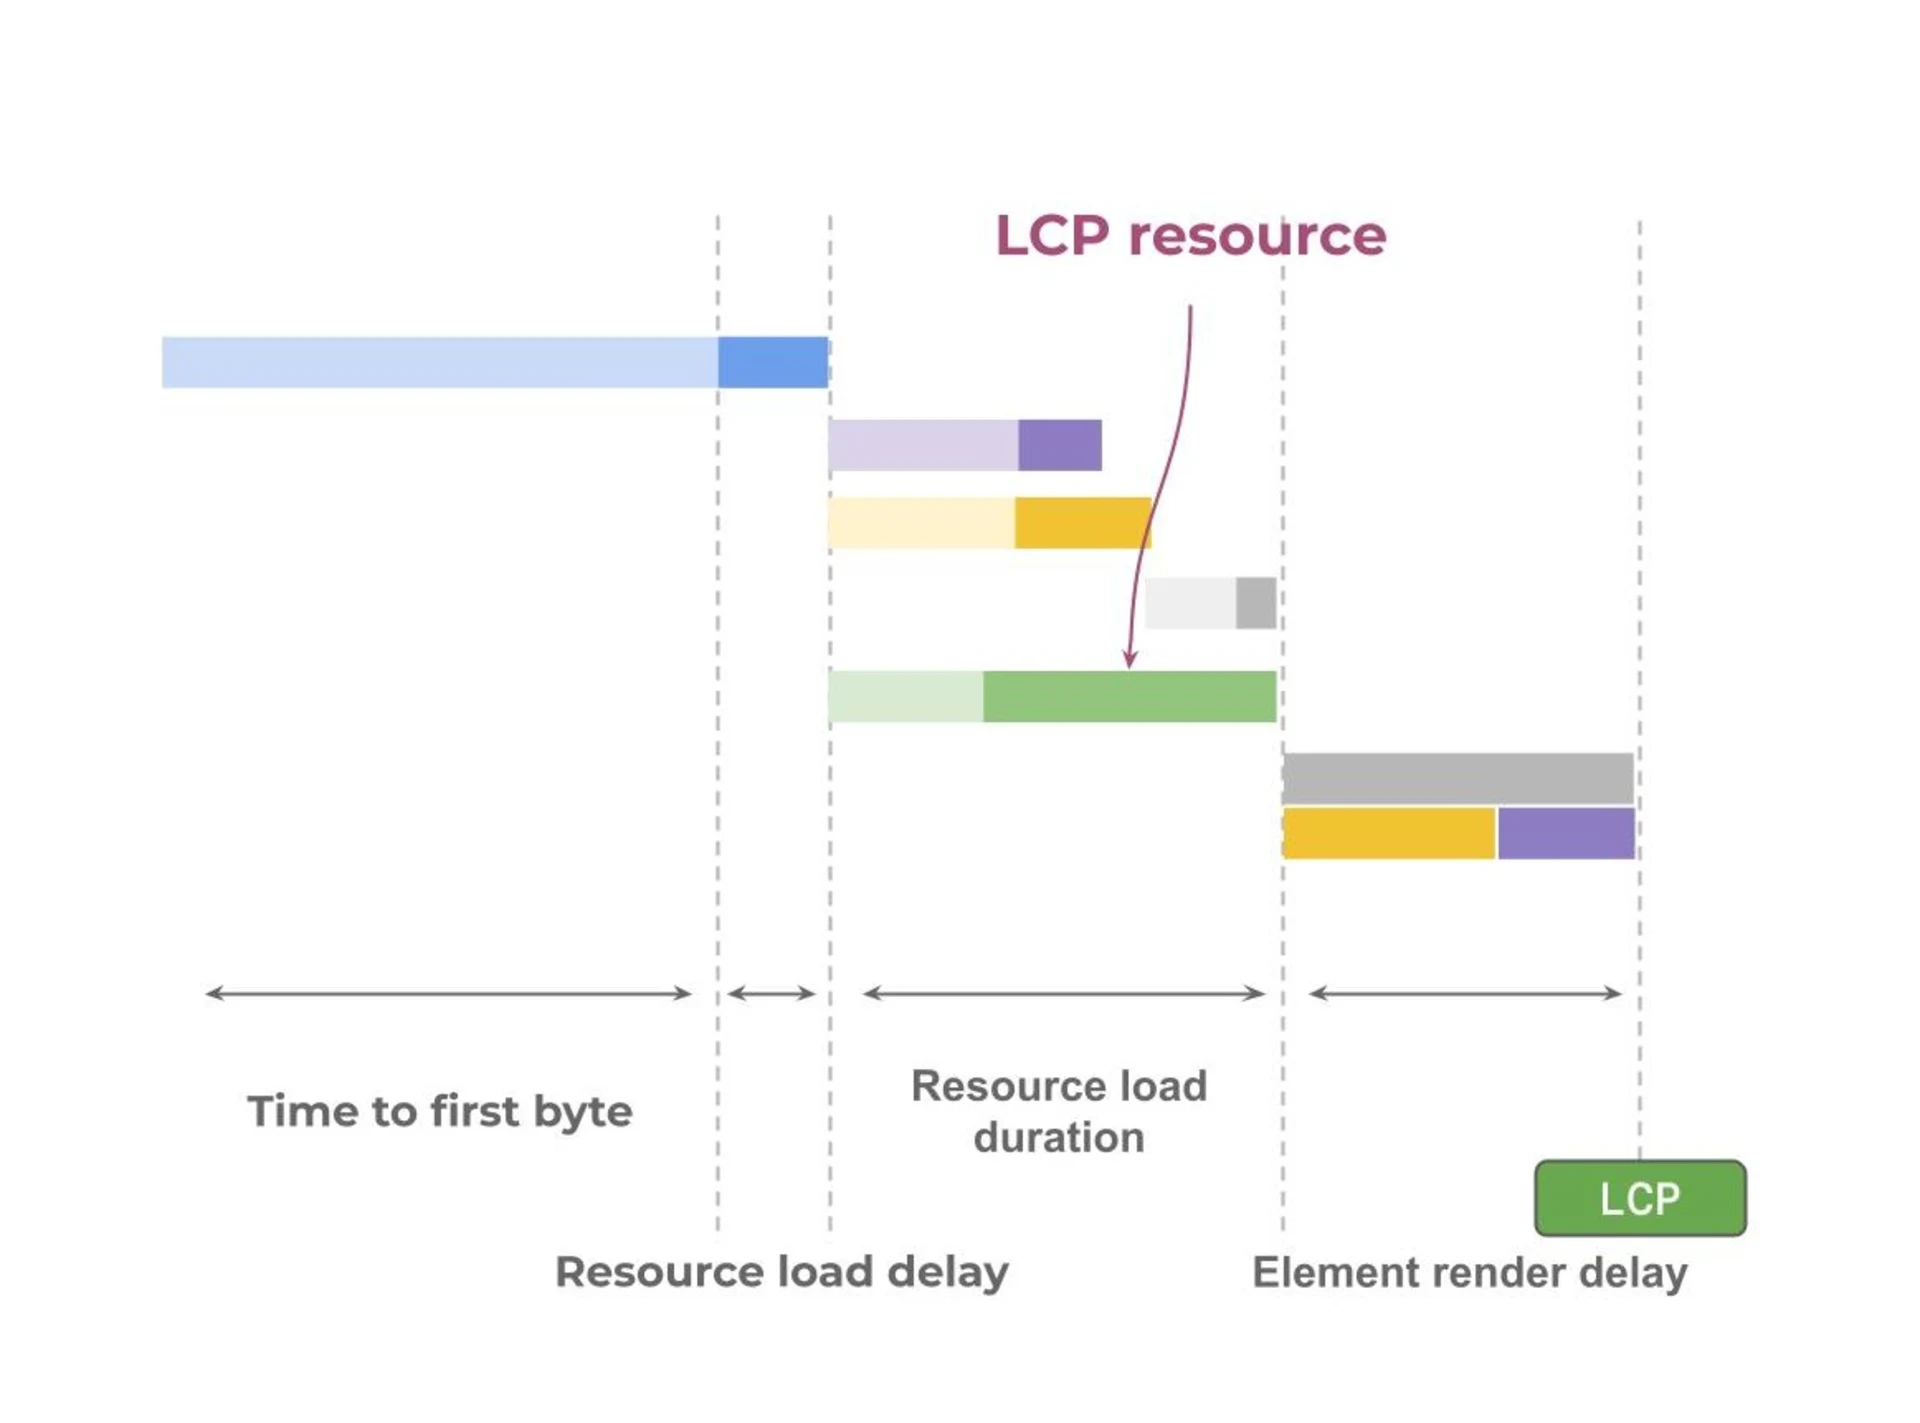
Optimal subpart times
If you struggle to find the correct spot where to start optimizing, there are official guidelines that give you an idea about how the optimal distribution between the different LCP phases should be.

Remember those values are only guidelines. If your LCP is consistently below the “good” threshold, there is absolutely no need to pursue this. However, as a rule of thumb, you should focus on optimizing the phases that cause an actual “delay”: Resource load delay & Element render delay.
The current state of LCP
Now that we’ve looked at the four components that shape LCP, let’s step back and ask the bigger question: how is everyone scoring?
Based on data from the Chrome User Experience Report (CrUX), the HTTP Archive (https://httparchive.org/) gives us insights about how the majority of the public web is experienced by real users.
According to the latest version of the Web Almanac, in 2024, 59% of mobile page visits scored a good LCP. Desktop users still scored significantly better with 72% good LCP experiences.
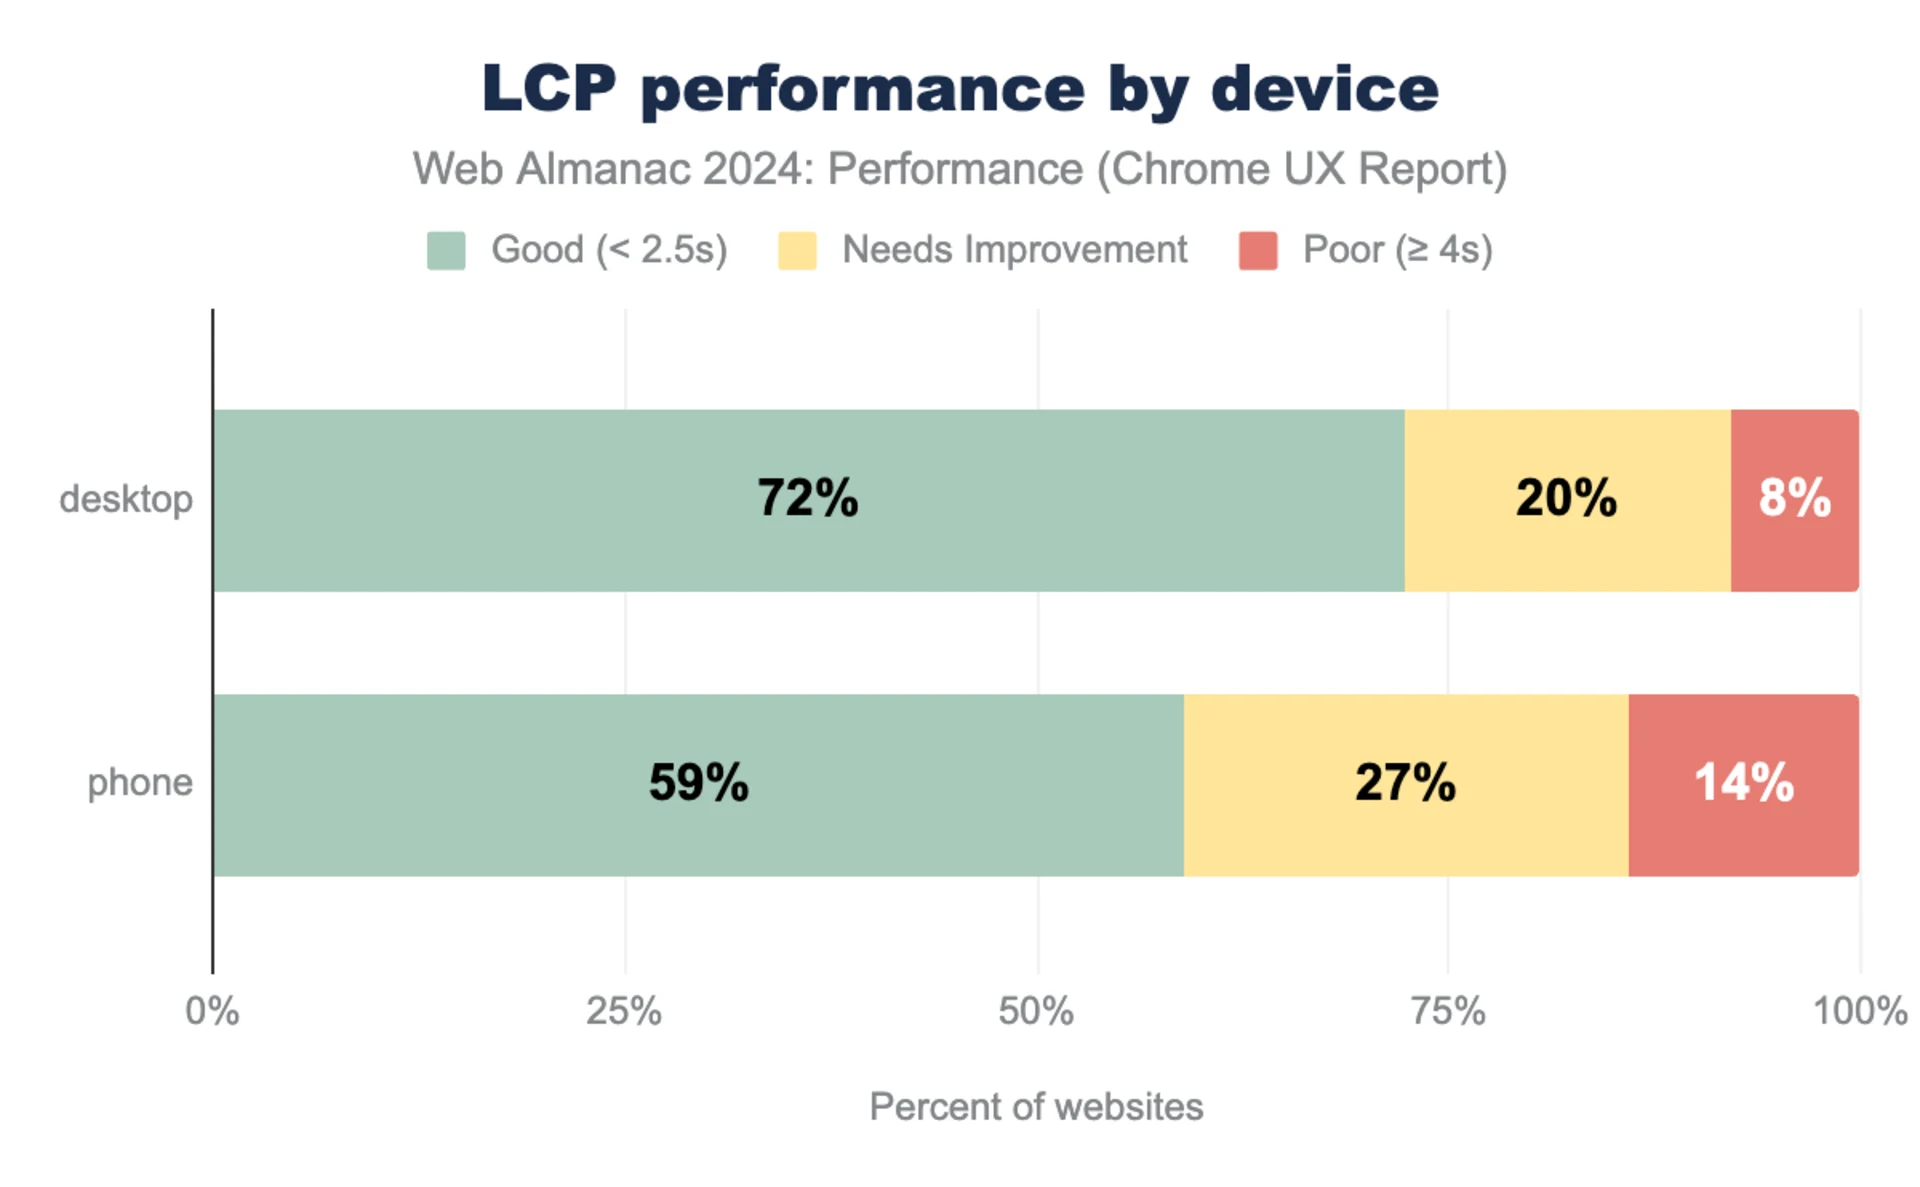
(source: https://almanac.httparchive.org/en/2024/performance#largest-contentful-paint-lcp)
LCP has been steadily improving over the past few years. In 2022, only 44% of LCP events were rated as good, while in 2024, that number rose to 54%.
A website is considered to have good LCP if at least 75 percent of all page visits load in less than 2 500 ms.
LCP over time
To better understand how LCP evolved over the years, we’ll take a look at the CrUX report itself. It allows us to look at an even longer time span, so we can explore LCP from 2021 → 2025.
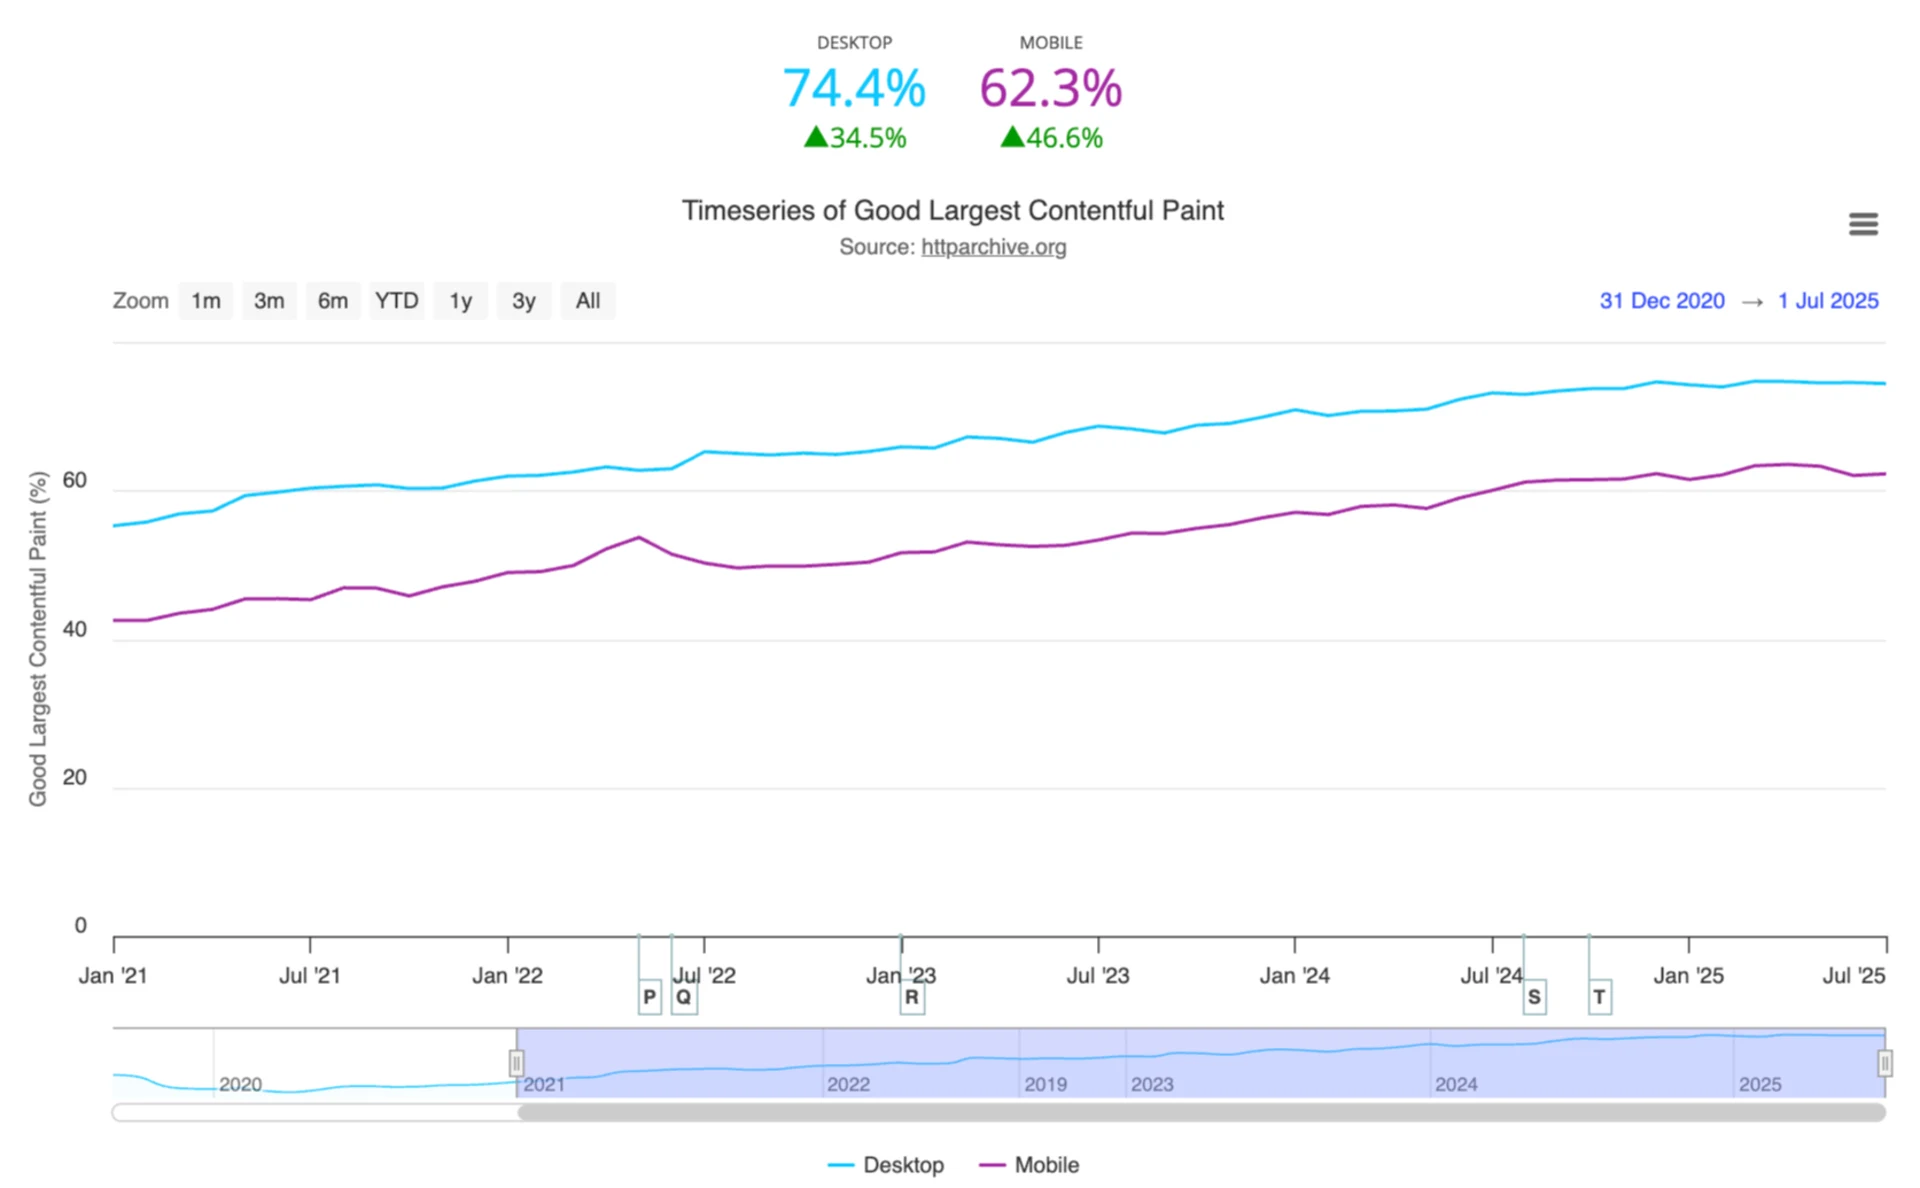
(source: https://httparchive.org/reports/chrome-ux-report#cruxFastLcp)
The CrUX report confirms the positive trend in LCP, with 62.3% of mobile page visits and 74.4% of desktop visits scoring "good" LCP in July 2025. For the mobile sector, this represents an impressive increase of 46.6% since 2021.
However, despite these gains, about one-third of all web users still don’t experience a “good” loading experience, highlighting the importance of continuous LCP improvements.
LCP resources
When it comes to user experiences and improvements, images play a key part as they are the most common LCP element, accounting for roughly 80% of all LCP resources.
On mobile devices, images are less often the largest contentful element, primarily because of their smaller viewport sizes, which lets text take over as the LCP candidate in some scenarios.
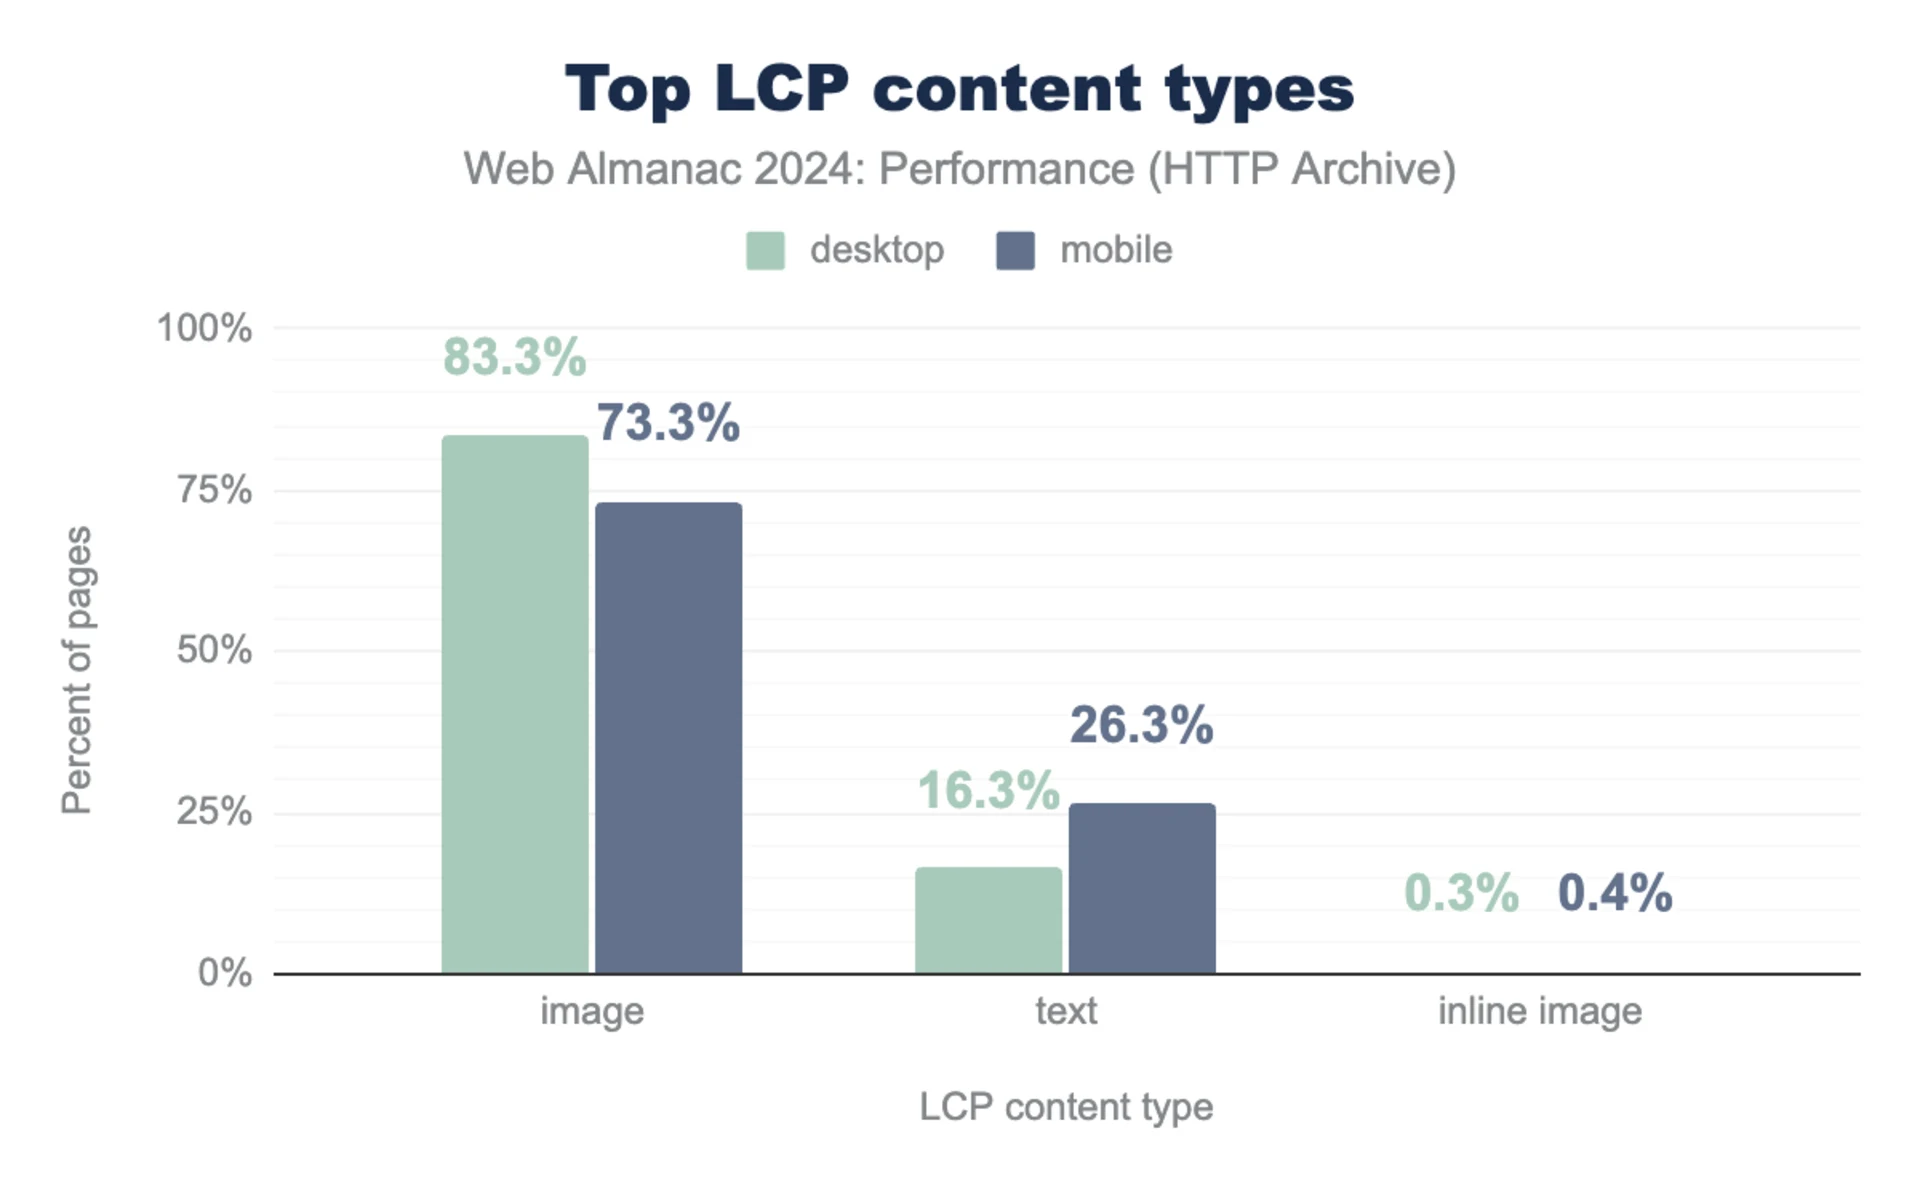
(source: https://almanac.httparchive.org/en/2024/performance#lcp-content-types)
Since images constitute the majority of LCP elements, it is important to make sure they are optimized. Right now, nearly half of mobile websites (48%) manage to keep their LCP images under 100KB. However, a small but notable 8% of mobile pages have LCP elements that exceed 1000KB. That's a clear sign there's a lot of room for improvement.
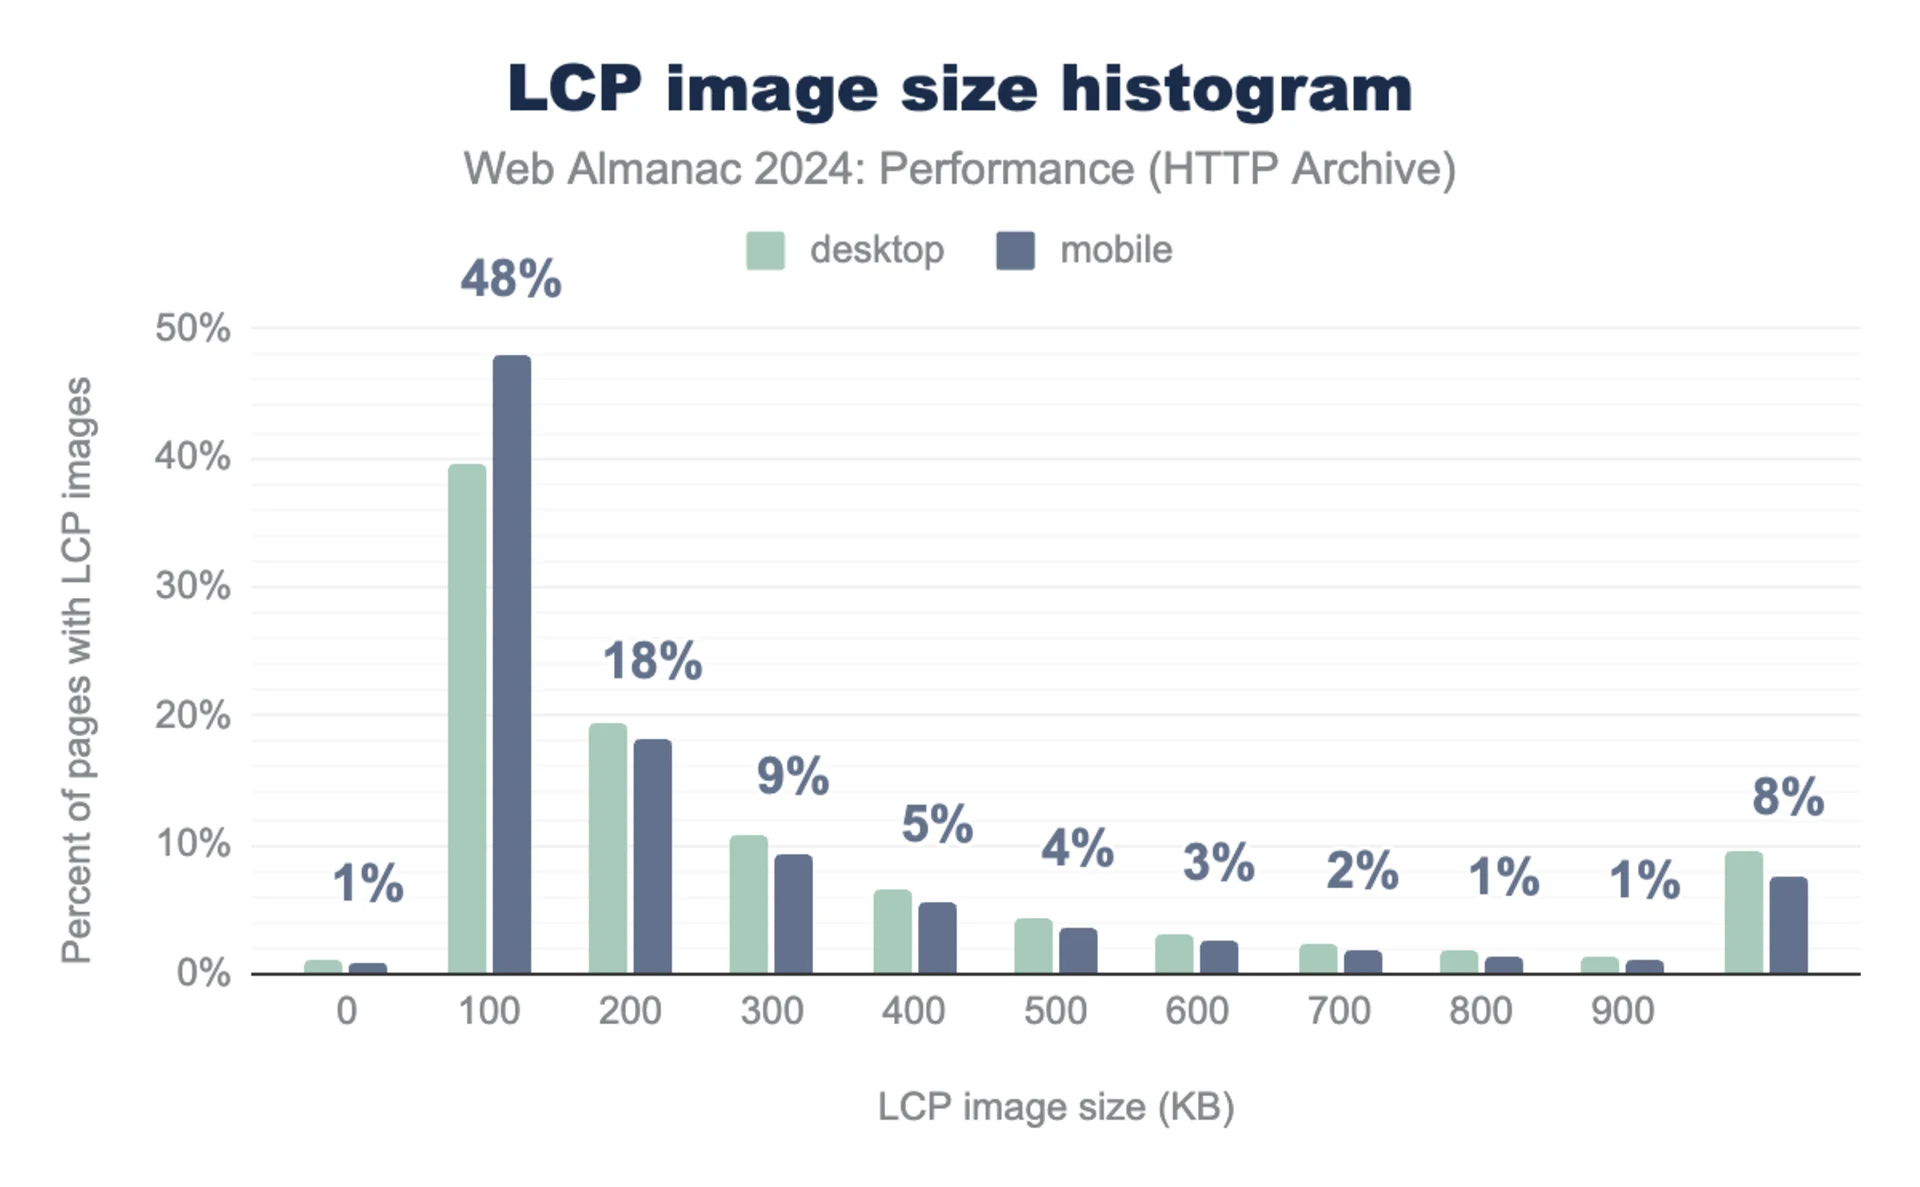
(source: https://almanac.httparchive.org/en/2024/performance#lcp-size)
We’ve already covered the importance of optimizing LCP assets and the impact on LCP in the Resource Load Duration section.
LCP sub-parts
Building on our earlier discussions about the four essential phases of LCP, let's explore insights provided by reports from the HTTP Archive, RumVision, and CrUX. These resources are invaluable for understanding the factors that contribute to LCP bottlenecks on the web.
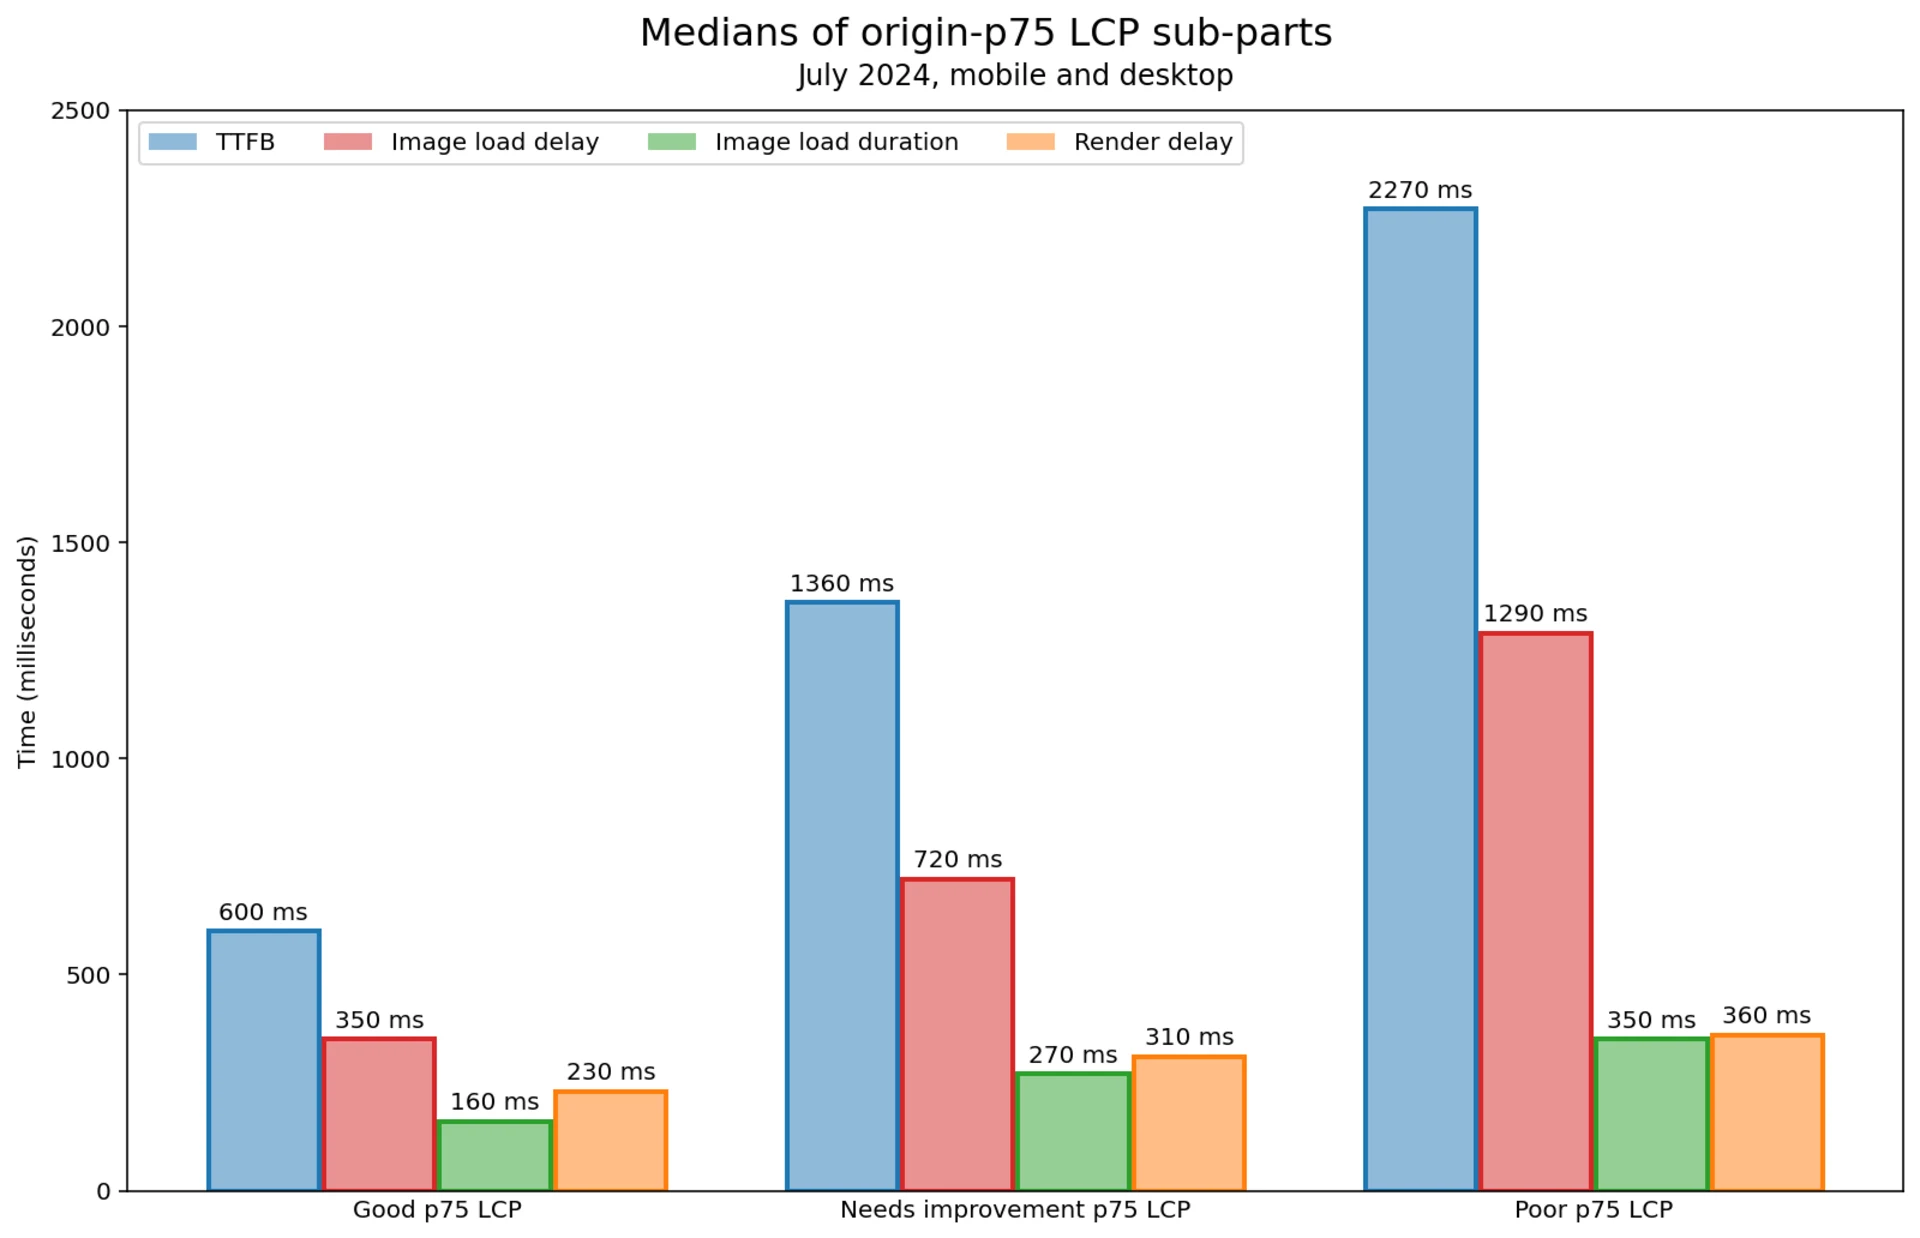
(source: https://almanac.httparchive.org/en/2024/performance#lcp-sub-parts)
According to Brendan Kenny, who analyzed a breakdown of LCP sub-parts using recent CrUX data, TTFB is the leading cause of poor LCP scores. In cases of bad user experience, 2,270 ms are attributed to it. This almost hits the "good" LCP threshold on its own.
CrUX data indicates image load delay as the second most significant factor. It is followed by image load duration and element render delay.
RUMvision data also supports TTFB as the primary contributor. It’s not as prominent as for the CrUX report, though the message stays the same. However, it places element render delay in second, ahead of image load delay and load duration.
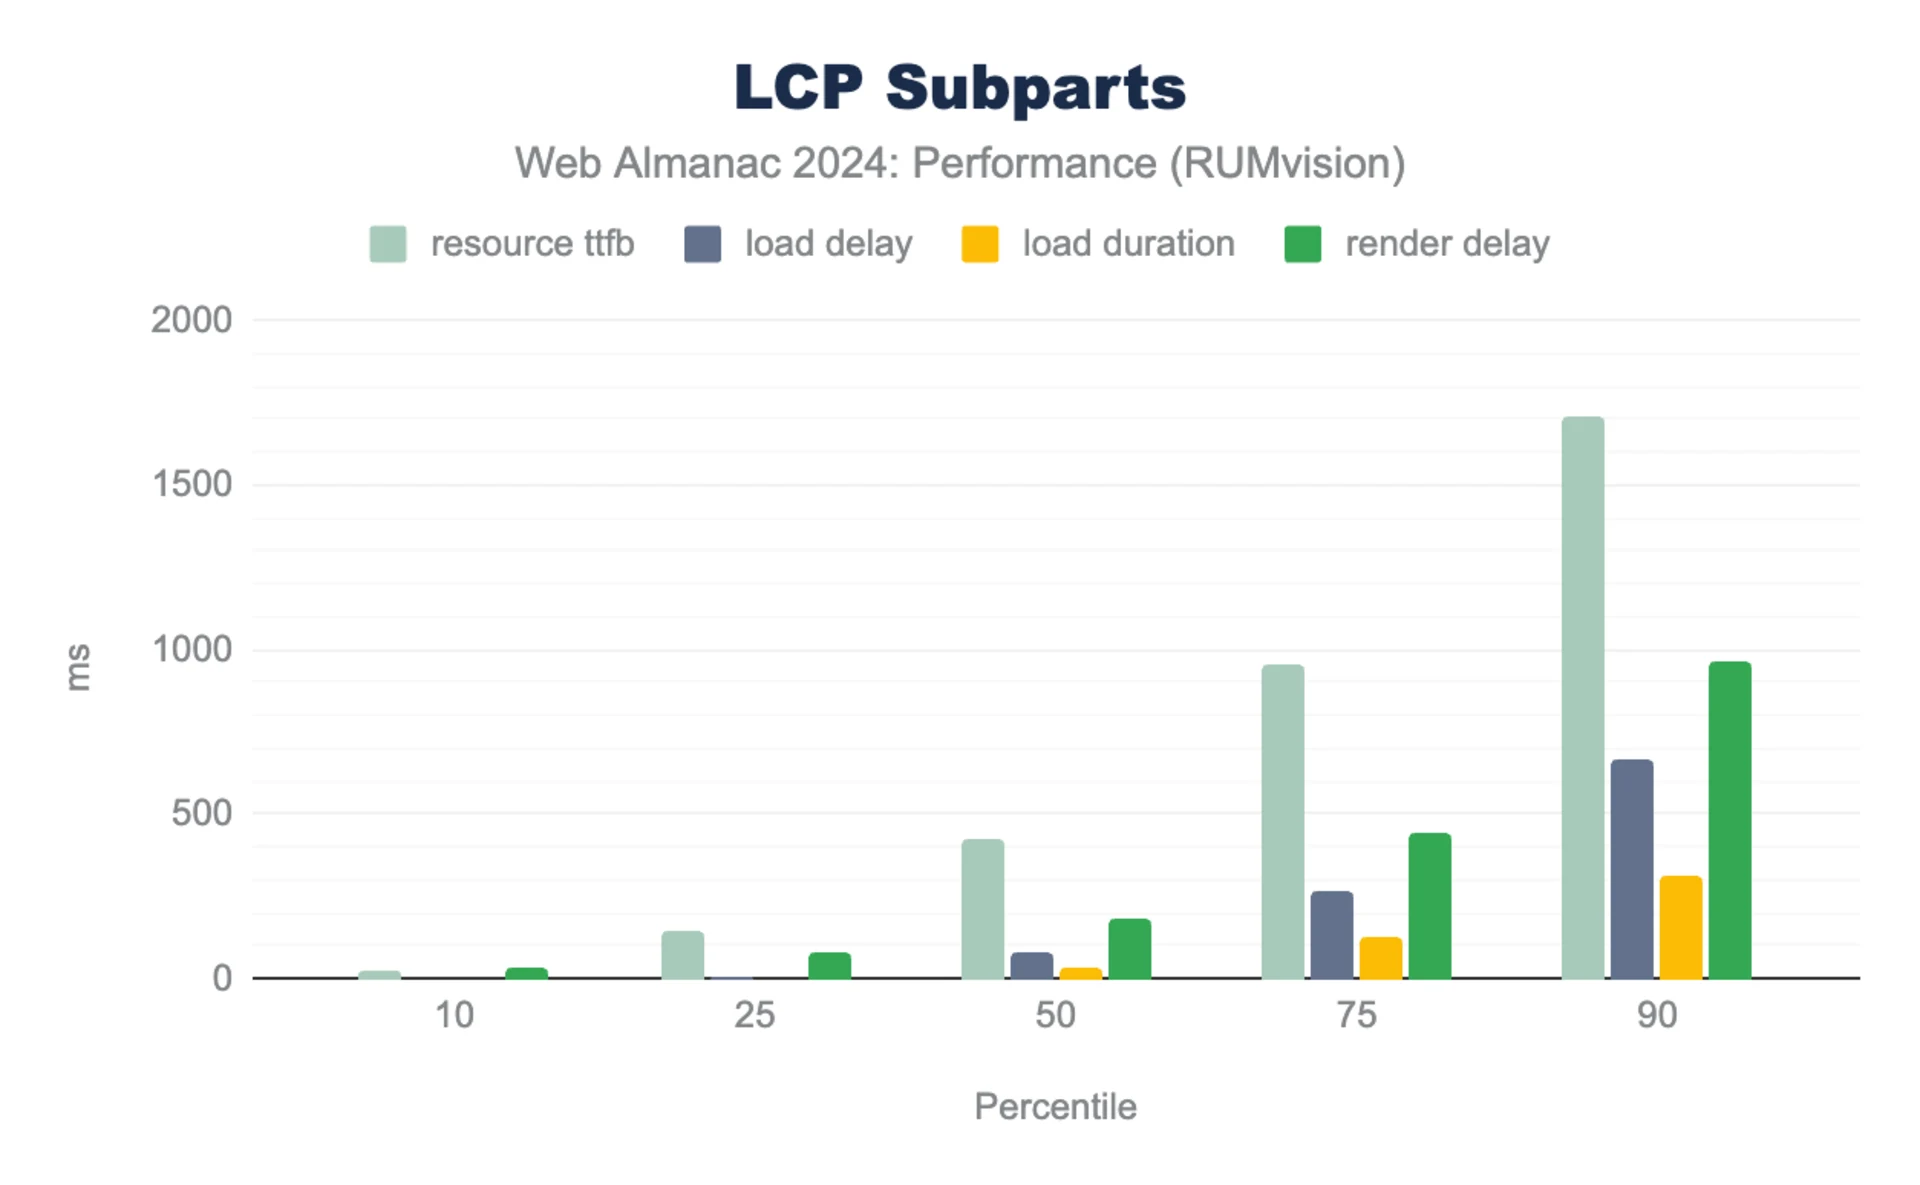
(source: https://almanac.httparchive.org/en/2024/performance#lcp-sub-parts)
The difference between the HTTP Archive and the RUMvision metrics lies in the different samples being used.
Despite differences in some LCP sub-parts, RUMvision as well as data underscores the critical need to address server response times and optimize image loading to further enhance overall LCP performance across the web.
How “good” is a “good” LCP?
The analysis of the current state of LCP clearly displays an upwards trend since the Core Web Vitals were introduced in 2020 by Google. 62.3% of all mobile users experience a “good” perceived loading speed according to the metric.
Today, in 2025, we need to ask ourselves if the threshold that was set 5 years ago is still valid or if it needs to be adjusted. Or in other words, should we stop optimizing LCP as soon as we've reached a “good” score?
Erik Witt from Speed Kit states in his article Don’t Settle for “Good”: It Is Time for New LCP Thresholds that “aiming for 2.5s LCP, however, simply isn't good enough these days for optimal user experience and business success”.
He suggests introducing two more buckets to the LCP metric to further distinguish between instant (< 300ms) and fast (< 1000ms) user experiences.
The idea is smart, because optimizations beyond the “good” LCP score are often not pursued any further even though they would result in increased conversion rates. It’s a good way to display optimization potential.
Ways to destroy your metric
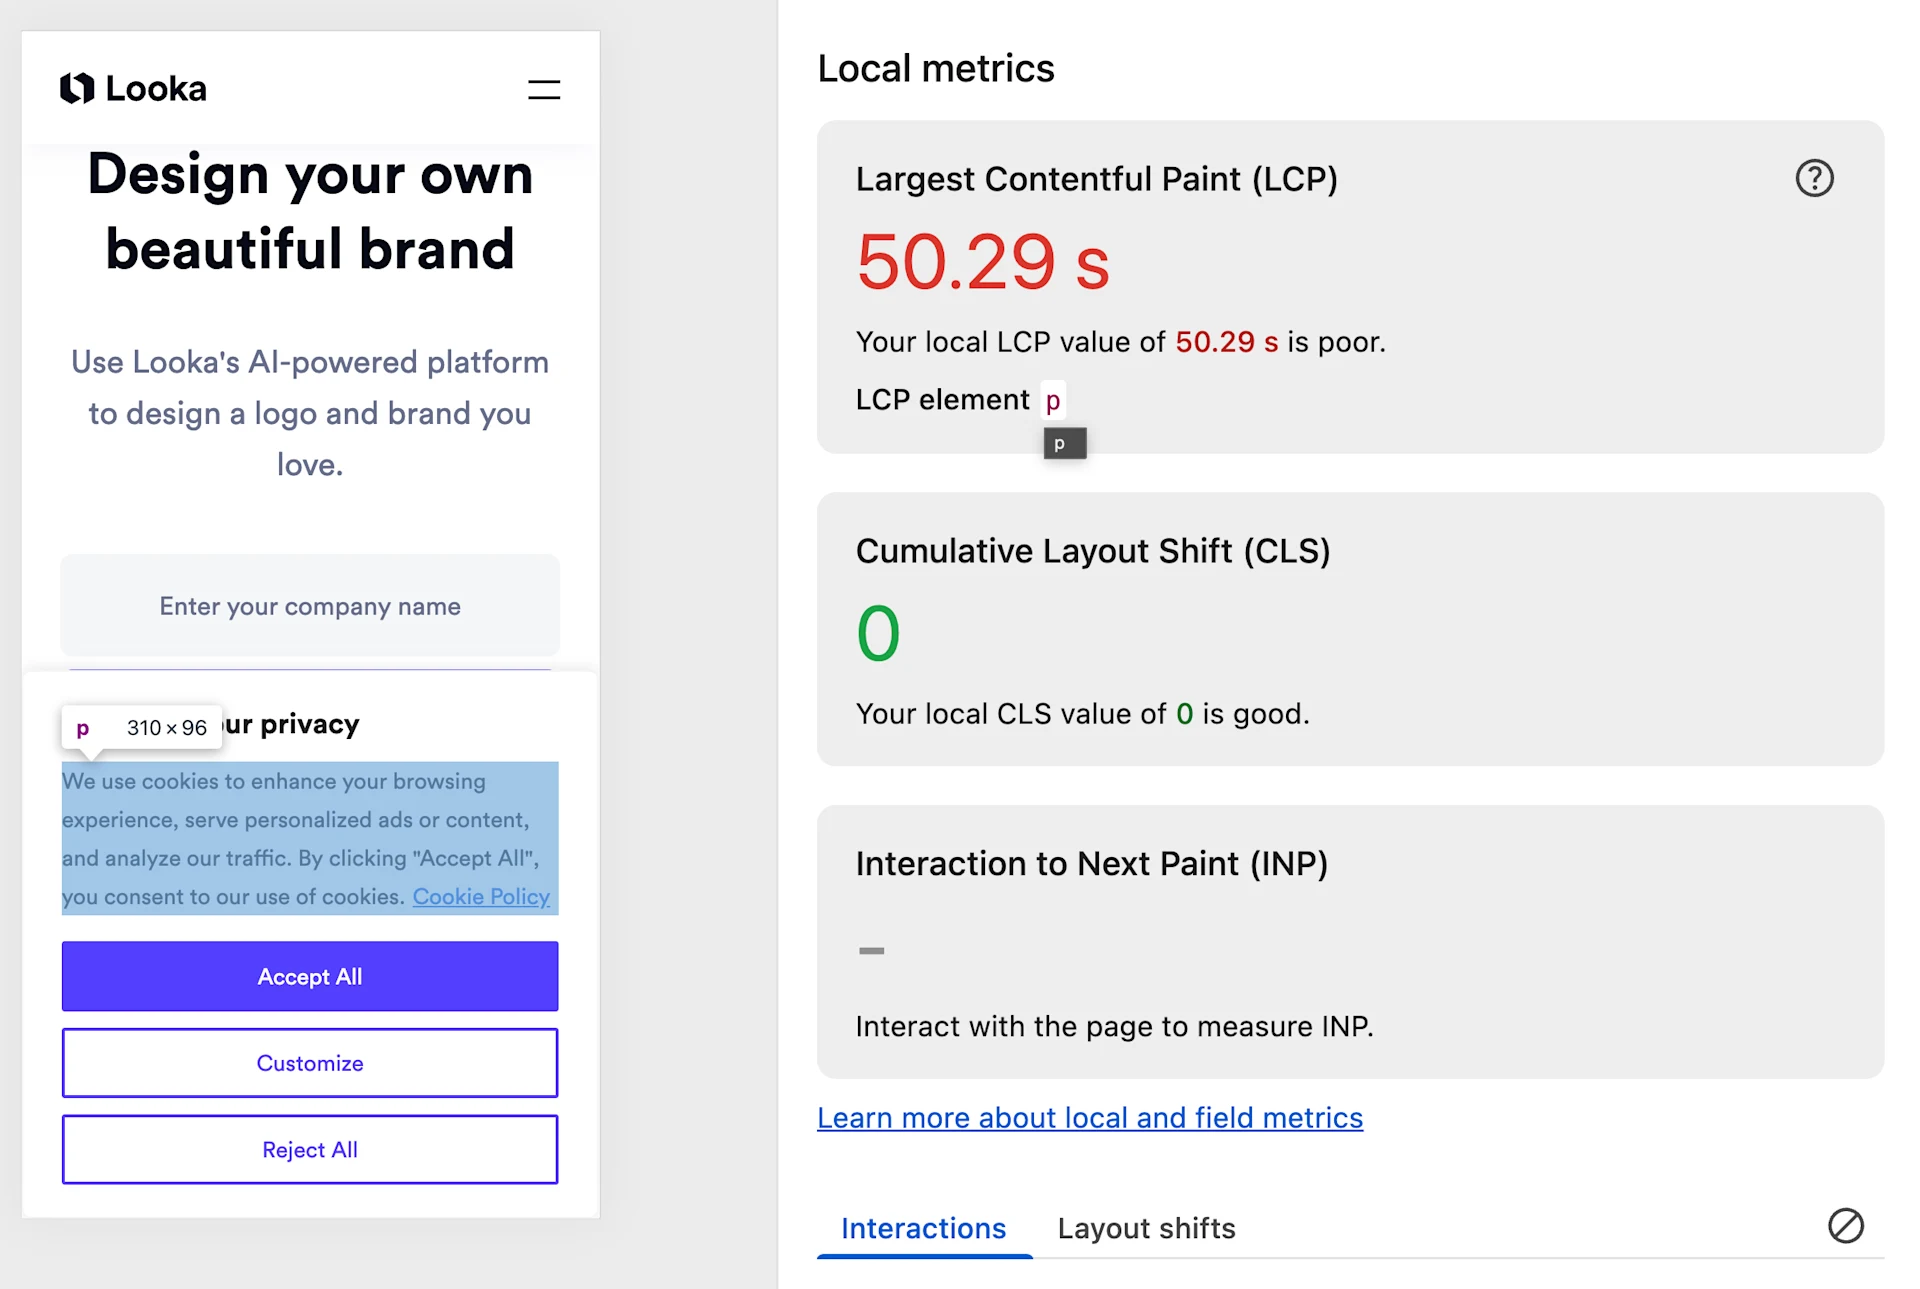
There are instances where your user experience isn’t accurately represented by the LCP metric. Cookie banners are a good example of how your measurements can be obscured by something very subtle.
In the following example you see an actual measurement under poor network conditions from the https://looka.com/ website.
The cookie banner is added very late to the DOM, but its contents make up for the largest element being rendered on the page. In this case it caused a > 50 second LCP value.
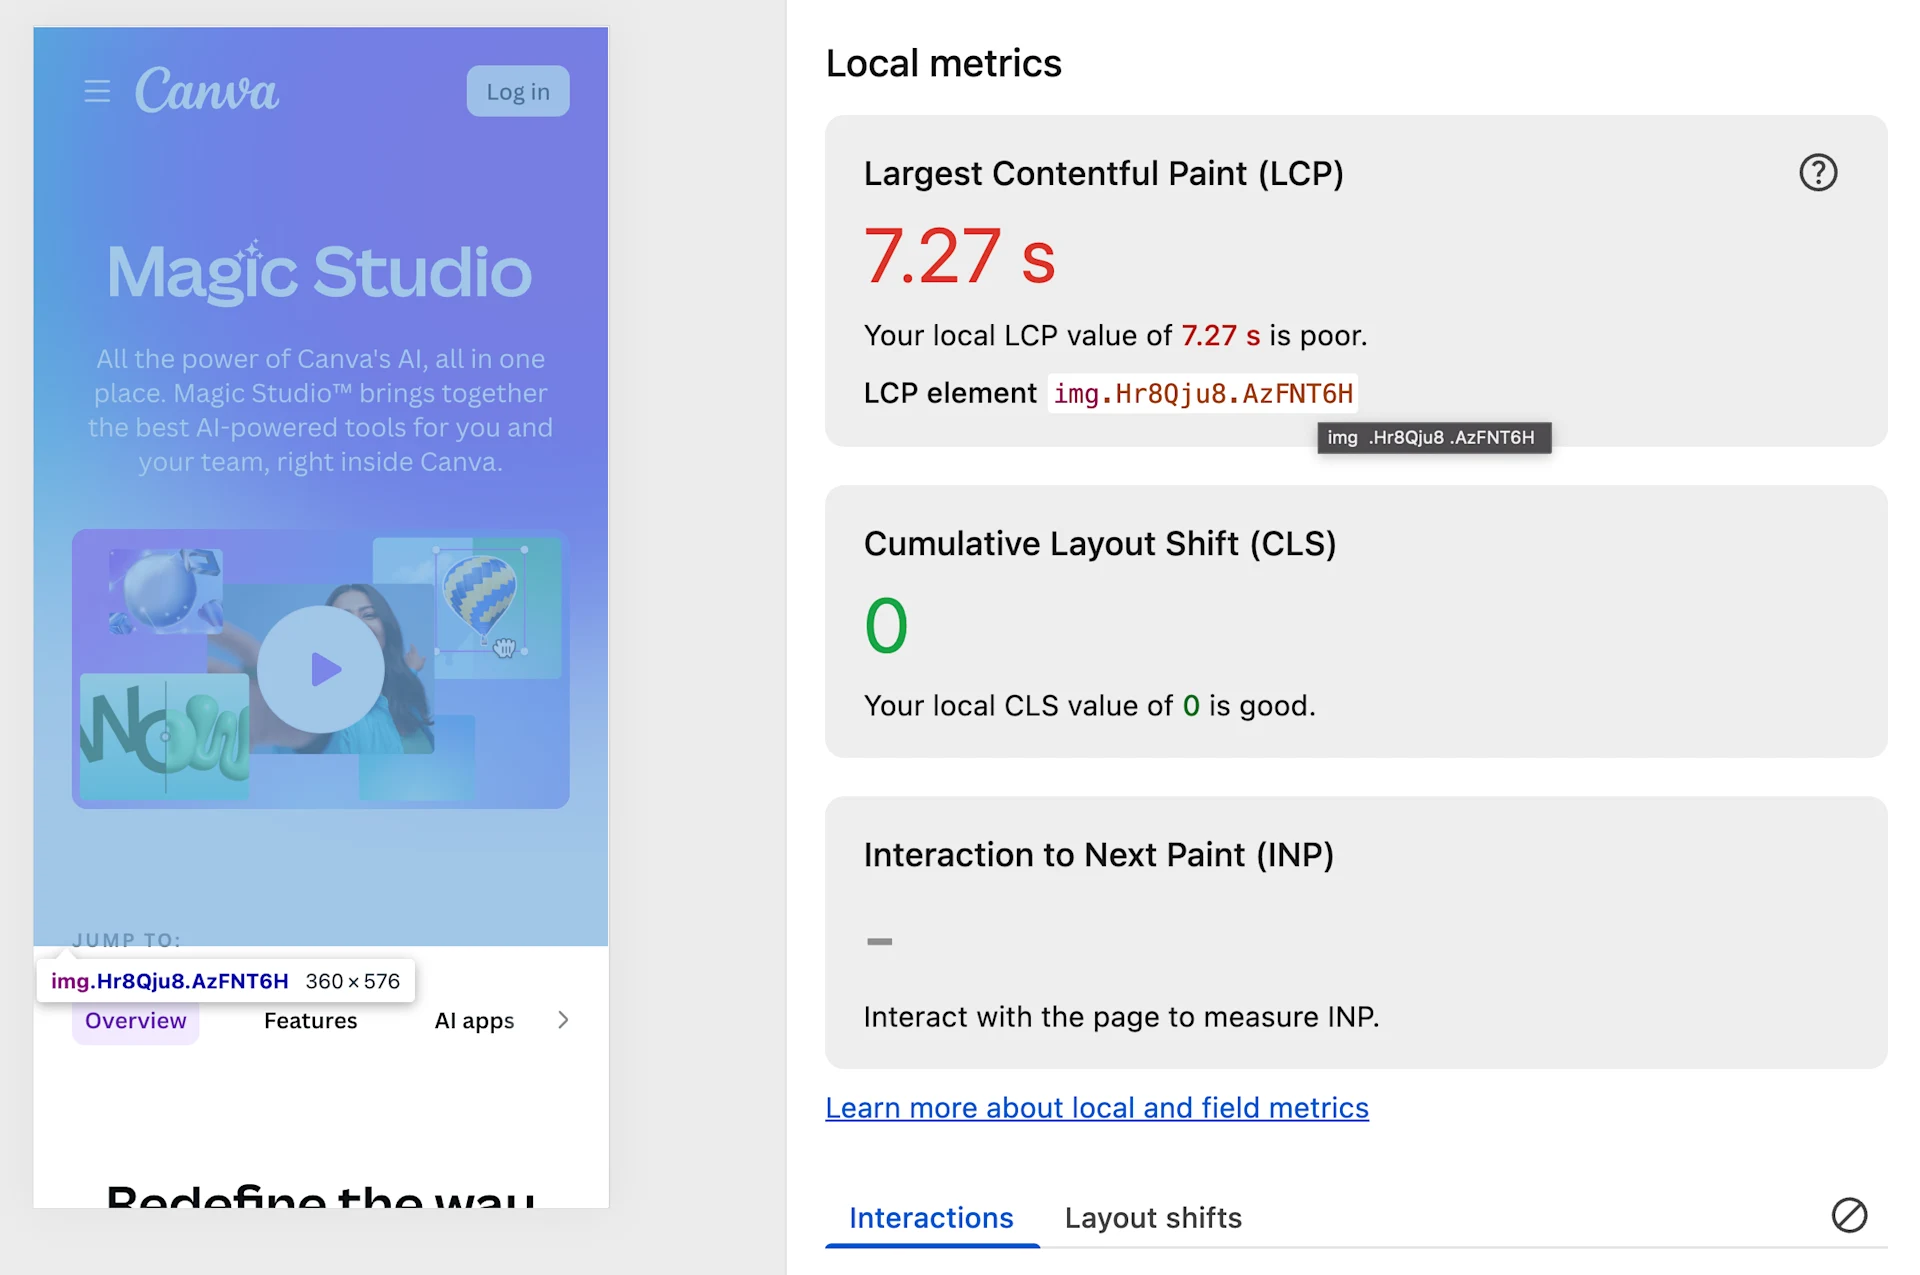
Lazy-loaded background images are another example. The user's critical information like the biggest headline or hero image is already loaded, but an image tag that only serves as a background overtakes the LCP measurement.
A good illustration of this can be found on the website https://www.canva.com/magic/.
Don’t cheat the metric
It’s surprisingly easy to “cheat” the LCP metric. For instance, you could statically inline a very large splash screen image which takes up the entire screen. This would make sure your LCP is always at a top score as the LCP resource is already inlined into your index.html.
While that might make the management happy for a while, you entirely lose control over your actual user experience. As a result, the LCP metric becomes useless, and you won’t be able to track any real improvements or regressions you introduce over time.
I highly recommend staying true to the metric and focusing on genuine improvements.
How to Convince Stakeholders to Prioritize LCP
Performance optimizations often face a battle against the development of new features. To successfully advocate for LCP prioritization, consider the following arguments:
Align with Business Objectives: Frame LCP improvements in terms of tangible business gains. A 1 second reduction in load time can translate to a 5-10% increase in conversion rates, directly impacting revenue.
Leverage Real-World Data and Case Studies: Present concrete examples. The documented successes of companies like Pinterest (15% increase in sign-ups after reducing load time) and Walmart (2% conversion boost from a one-second LCP reduction) provide strong evidence of a clear return on investment.
Emphasize SEO Benefits: Highlight that Google incorporates Core Web Vitals, including LCP, into its search ranking algorithms. Poor LCP directly leads to decreased visibility in search results and, consequently, lost organic traffic.
Quantify User Impact with RUM Data: Utilize Real User Monitoring (RUM) data to illustrate the direct consequences of poor LCP on user behavior. For example, demonstrating that 30% of mobile visitors abandon a page before the main content loads can be a powerful motivator.
By framing LCP optimization as a strategic initiative for growth and user retention, rather than a mere technical task, you can effectively convince stakeholders to prioritize it. This is further underscored by data showing that bounce rates more than double for pages with a 5-second LCP compared to those with a 2-second LCP.
Ultimately, optimizing LCP isn't just about chasing a number, it's about delivering an experience that makes users choose you over your competitors, driving business results. In Part 2 of this series, you’ll learn how to apply the theory in practice. Based on a real-world lab environment, I’m going to walk you through the process of how a performance engineer systematically measures and improves LCP.

Advanced workshop
Architecting Angular Apps for High Performance
High-Speed Angular applications on any device
Learn morePart 1 of 2 in our What is LCP and Why it matters series
- What Is LCP And Why It Matters: Unlock Instant Page Experiences - Part 1
- What Is LCP And Why It Matters: Unlock Instant Page Experiences - Part 2

Advanced workshop
Architecting Angular Apps for High Performance
High-Speed Angular applications on any device
Learn moreRead next

What Is LCP And Why It Matters: Unlock Instant Page Experiences - Part 2
Part 2 is a practical walkthrough to diagnose and speed up LCP. Learn to read CrUX trends, profile in Chrome DevTools, preload critical assets, use srcset, defer third-party scripts, and code-split Angular bundles to turn red LCP into green.
Advanced CPU Profiling in Node - Real-Life Examples
Profiling is easiest when it's real. Learn how to capture and make sense of CPU profiles in Node.js across scripts, threads, and processes—then apply it to your own projects.
Advanced CPU Profiling in Node - Profile Data Structure
CPU profiles are more than flame charts—they’re structured JSON files. Learn how nodes, samples, and time deltas form the backbone of DevTools performance data.
Advanced CPU Profiling in Node - Best Practices and Pitfalls
Get deeper insights into your Node.JS performance. Learn how to master advanced CPU profiling with built-in tools, interpret process/thread IDs, and optimize using sampling intervals. Troubleshooting and real examples included.
Goodbye 'ControlValueAccessor', Hello Signals! 👋🚦
Angular is bridging the gap between the new Signal-Forms architecture and the Template/Reactive Forms. This isn't just a minor update—it’s a fundamental shift in how we author custom form controls.

Observable HQ - Performance Audit
A small performance audit including thought processes and methodology


