
Advanced workshop
Architecting Angular Apps for High Performance
High-Speed Angular applications on any device
Learn more
CPU profiles in Chrome DevTools can reveal a lot about how your application runs, but making sense of the underlying data structures isn’t always straightforward. Even experienced developers often find the structure of these JSON files less than intuitive. In this article, we break down the main components that make up CPU profile data and examine how they’re represented in DevTools. With a clearer grasp of these building blocks, you will be better equipped to investigate performance and spot optimization opportunities.
CPU profiles are JSON files that contain structured data representing the execution timeline and call hierarchy of your Node.js application. The profile consists of nodes representing function calls, timing information, and sampling data that can be visualized in DevTools.
type CpuProfile = {
  // List of nodes in the CPU profile
  nodes: Node[];
  // Start time of the profile in microseconds (μs)
  startTime: number;
  // End time of the profile in microseconds (μs)
  endTime: number;
  // List of node IDs indicating which nodes were active during the profile. e.g. [2,4,5]
  samples: number[];
  // List of time deltas between samples in microseconds (μs)
  timeDeltas: number[];
};
The example below shows a minimal CPU profile.
Profile: minimal-cpu-profile.cpuprofile
Profile content:
{
  "nodes": [
    {
      "id": 1,
      "callFrame": {
        "functionName": "(root)",
        "scriptId": "0",
        "url": "",
        "lineNumber": -1,
        "columnNumber": -1
      },
      "children": [2]
    },
    {
      "id": 2,
      "callFrame": {
        "functionName": "runMainESM",
        "scriptId": "1",
        "url": "node:internal/modules/run_main",
        "lineNumber": 92,
        "columnNumber": 19
      },
      "children": [3]
    },
    {
      "id": 3,
      "callFrame": {
        "functionName": "main-work",
        "scriptId": "2",
        "url": "file:///index.mjs",
        "lineNumber": 10,
        "columnNumber": 0
      },
      "children": [4, 5]
    },
    {
      "id": 4,
      "callFrame": {
        "functionName": "child-work-1",
        "scriptId": "2",
        "url": "file:///index.mjs",
        "lineNumber": 11,
        "columnNumber": 2
      }
    },
    {
      "id": 5,
      "callFrame": {
        "functionName": "child-work-2",
        "scriptId": "2",
        "url": "file:///index.mjs",
        "lineNumber": 12,
        "columnNumber": 2
      }
    }
  ],
  "startTime": 1,
  "endTime": 400,
  "samples": [2, 4, 5],
  "timeDeltas": [0, 100, 100]
}
DevTools Performance Tab:
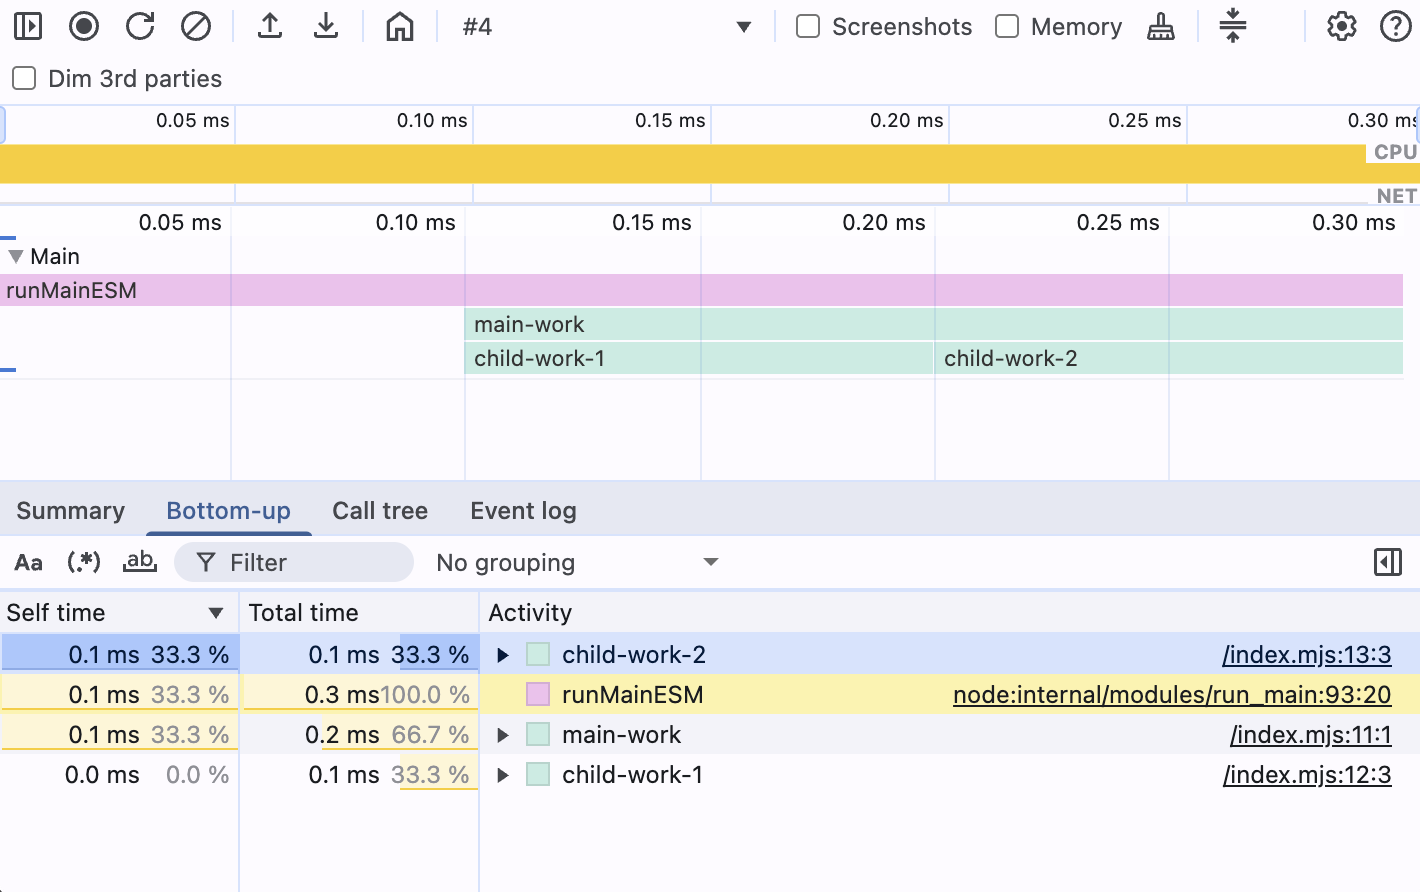
CPU profiles represent execution data across two primary dimensions: time (horizontal axis) and call-tree depth (vertical axis). Understanding these dimensions is crucial for interpreting flame charts and performance data.
startTime
endTimestartTime + Σ timeDeltas
timeDeltas
samples
Time (horizontal axis) represents the execution timeline with startTimeendTimetimeDeltas
Call-tree depth (vertical axis) shows the function call hierarchy where the root node is at depth 0, and each level represents nested function calls. The samples
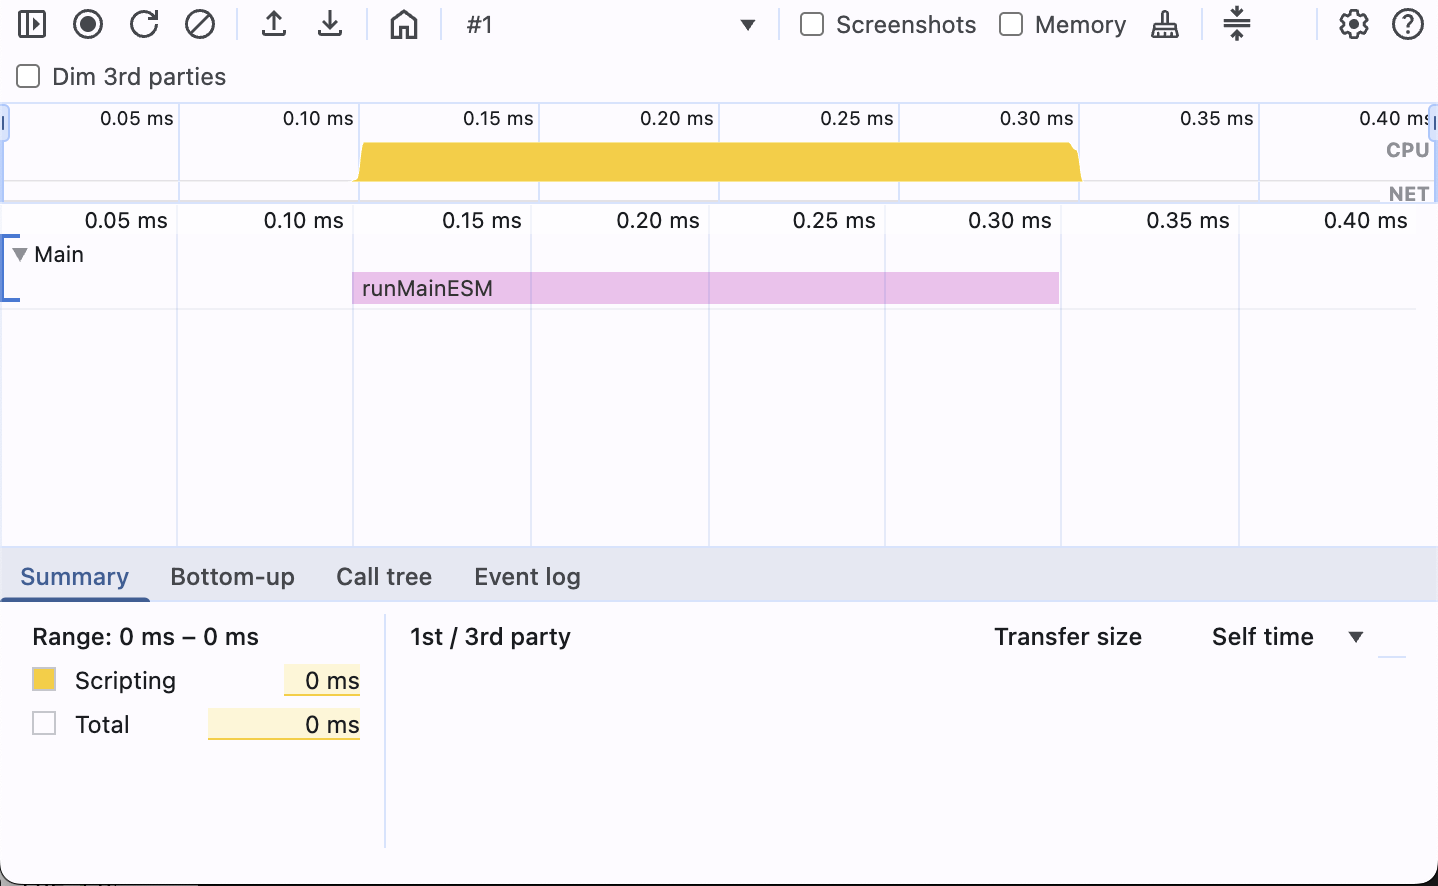
The example below shows a profile with one node (ID 2) centered in the middle of the chart. Its position in the timeline is determined by the timeDeltasendTime
Profile: minimal-cpu-profile-timing-data.cpuprofile
{
  "nodes": [
    {
      "id": 1,
      "callFrame": {
        "functionName": "(root)",
        "scriptId": "0",
        "url": "",
        "lineNumber": -1,
        "columnNumber": -1
      },
      "children": [2]
    },
    {
      "id": 2,
      "callFrame": {
        "functionName": "runMainESM",
        "scriptId": "1",
        "url": "node:internal/modules/run_main",
        "lineNumber": 92,
        "columnNumber": 19
      },
      "children": []
    }
  ],
  "startTime": 1,
  "endTime": 400,
  "samples": [1, 2, 2, 1],
  "timeDeltas": [0, 100, 100, 100]
}
DevTools Performance Tab:
Profile: minimal-cpu-profile-timing-data-time-deltas.cpuprofile
{
  "nodes": [
    {
      "id": 1,
      "callFrame": {
        "functionName": "(root)",
        "scriptId": "0",
        "url": "",
        "lineNumber": -1,
        "columnNumber": -1
      },
      "children": [2, 3]
    },
    {
      "id": 2,
      "callFrame": {
        "functionName": "work-1",
        "scriptId": "1",
        "url": "file:///a.js",
        "lineNumber": 92,
        "columnNumber": 19
      }
    },
    {
      "id": 3,
      "callFrame": {
        "functionName": "work-2",
        "scriptId": "2",
        "url": "file:///b.js",
        "lineNumber": 92,
        "columnNumber": 19
      }
    }
  ],
  "startTime": 4,
  "endTime": 27,
  "samples": [1, 2, 1, 3, 1, 2, 1, 3],
  "timeDeltas": [0, 1, 3, 2, 5, 1, 4, 2]
}
DevTools Performance Tab:
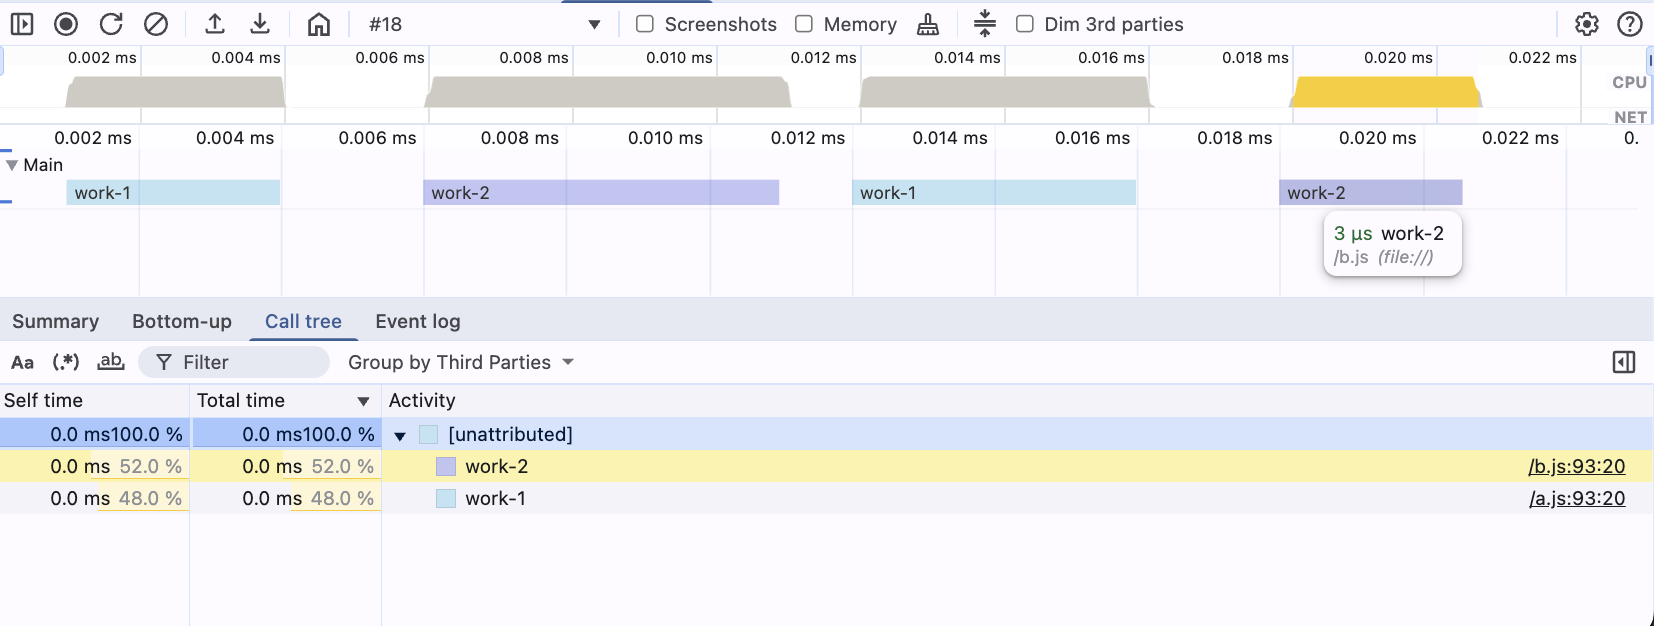
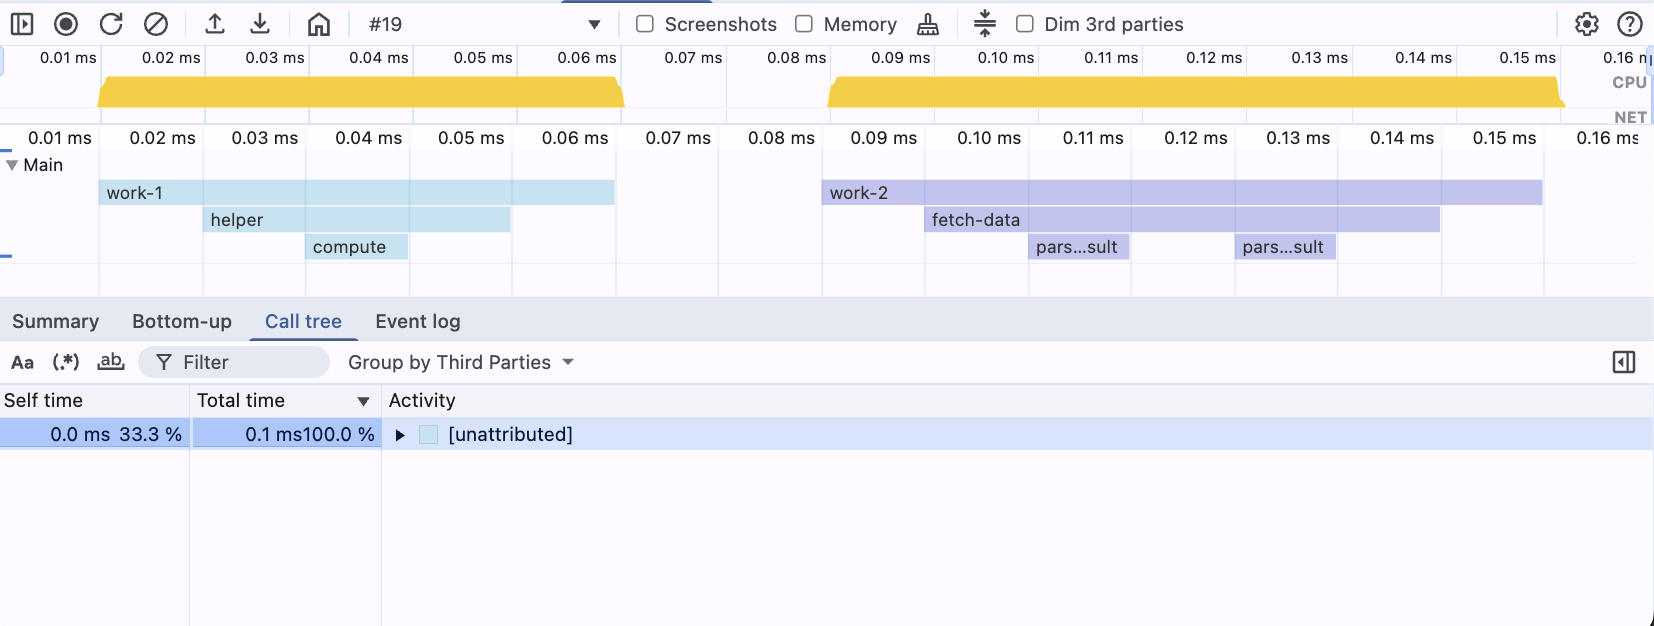
Samples are the list of "visible" nodes when viewed from the bottom of the chart. Listing a node at a given timeDeltasamplessamples
Profile: minimal-cpu-profile-timing-data-samples.cpuprofile
{
  "nodes": [
    {
      "id": 1,
      "callFrame": {
        "functionName": "(root)",
        "scriptId": "0",
        "url": "",
        "lineNumber": -1,
        "columnNumber": -1
      },
      "children": [2, 3]
    },
    {
      "id": 2,
      "callFrame": {
        "functionName": "work-1",
        "scriptId": "1",
        "url": "file:///a.js",
        "lineNumber": 92,
        "columnNumber": 19
      },
      "children": [4]
    },
    {
      "id": 4,
      "callFrame": {
        "functionName": "helper",
        "scriptId": "1",
        "url": "file:///a.js",
        "lineNumber": 98,
        "columnNumber": 5
      },
      "children": [5]
    },
    {
      "id": 5,
      "callFrame": {
        "functionName": "compute",
        "scriptId": "1",
        "url": "file:///a.js",
        "lineNumber": 99,
        "columnNumber": 5
      }
    },
    {
      "id": 3,
      "callFrame": {
        "functionName": "work-2",
        "scriptId": "2",
        "url": "file:///b.js",
        "lineNumber": 92,
        "columnNumber": 19
      },
      "children": [6]
    },
    {
      "id": 6,
      "callFrame": {
        "functionName": "fetch-data",
        "scriptId": "2",
        "url": "file:///b.js",
        "lineNumber": 120,
        "columnNumber": 3
      },
      "children": [7]
    },
    {
      "id": 7,
      "callFrame": {
        "functionName": "parse-result",
        "scriptId": "2",
        "url": "file:///b.js",
        "lineNumber": 121,
        "columnNumber": 5
      }
    }
  ],
  "startTime": 1,
  "endTime": 160,
  "samples": [1, 2, 4, 5, 4, 2, 1, 1, 3, 6, 7, 6, 7, 6, 3, 1],
  "timeDeltas": [0, 10, 10, 10, 10, 10, 10, 10, 10, 10, 10, 10, 10, 10, 10, 10]
}
This example draws the same node sequence (1->2->3) twice.
The first time, it draws them as a tower, where each frame has the same width (takes the same time).
"samples": [1, 3, 3, 1], "timeDeltas": [0, 100, 100, 100]
(visualized as ▀▀)
The second time, it draws them as a flame, where each frame is slightly narrower and nested inside its parent.
"samples": [1, 2, 3, 2, 1], "timeDeltas": [0, 100, 100, 100, 100]
(visualized as ▔▀▔)
DevTools Performance Tab:
/**
 * Represents a node in the CPU profile.
 * Each node corresponds to a function call and contains information about
 * the call frame, its children, and an optional hit count.
 */
type Node = {
  // Unique identifier for the node e.g. 1
  id: number;
  // Call frame information for the node
  callFrame: CallFrame;
  // Optional parent node ID, indicating the node that called this one. e.g. 1
  parent?: number;
  // List of child node IDs called by this node. e.g. [2,3]
  children: number[];
  // Optional hit count for the node, indicating how many times it was executed
  hitCount?: number;
};
Node relationships define the call hierarchy through parent-child references that mirror the JavaScript call stack. These relationships enable reconstruction of the complete call tree for flame chart visualization and performance analysis.
export interface Node {
  id: number;
  callFrame: CallFrame;
  parent?: number;
  children: number[];
  hitCount?: number;
}
parentchildren
Traversal starts at the root (no parentchildren
Profile: minimal-cpu-profile-nodes-parent-child.cpuprofile
{
  "nodes": [
    {
      "id": 1,
      "callFrame": {
        "functionName": "(root)",
        "scriptId": "0",
        "url": "",
        "lineNumber": -1,
        "columnNumber": -1
      },
      "children": [2]
    },
    {
      "id": 2,
      "callFrame": {
        "functionName": "runMainESM",
        "scriptId": "1",
        "url": "node:internal/modules/run_main",
        "lineNumber": 92,
        "columnNumber": 19
      },
      "parent": 1,
      "children": [3, 4]
    },
    {
      "id": 3,
      "callFrame": {
        "functionName": "child-1",
        "scriptId": "2",
        "url": "index.js",
        "lineNumber": 3,
        "columnNumber": 63
      },
      "parent": 2,
      "children": []
    },
    {
      "id": 4,
      "callFrame": {
        "functionName": "child-2",
        "scriptId": "2",
        "url": "index.js",
        "lineNumber": 3,
        "columnNumber": 63
      },
      "parent": 2,
      "children": [5]
    },
    {
      "id": 5,
      "callFrame": {
        "functionName": "child-2-1",
        "scriptId": "2",
        "url": "index.js",
        "lineNumber": 3,
        "columnNumber": 63
      },
      "parent": 4,
      "children": [6]
    },
    {
      "id": 6,
      "callFrame": {
        "functionName": "child-2-1-1",
        "scriptId": "2",
        "url": "index.js",
        "lineNumber": 3,
        "columnNumber": 63
      },
      "parent": 4
    }
  ],
  "startTime": 1,
  "endTime": 10,
  "samples": [6],
  "timeDeltas": [0]
}
DevTools Performance Tab:
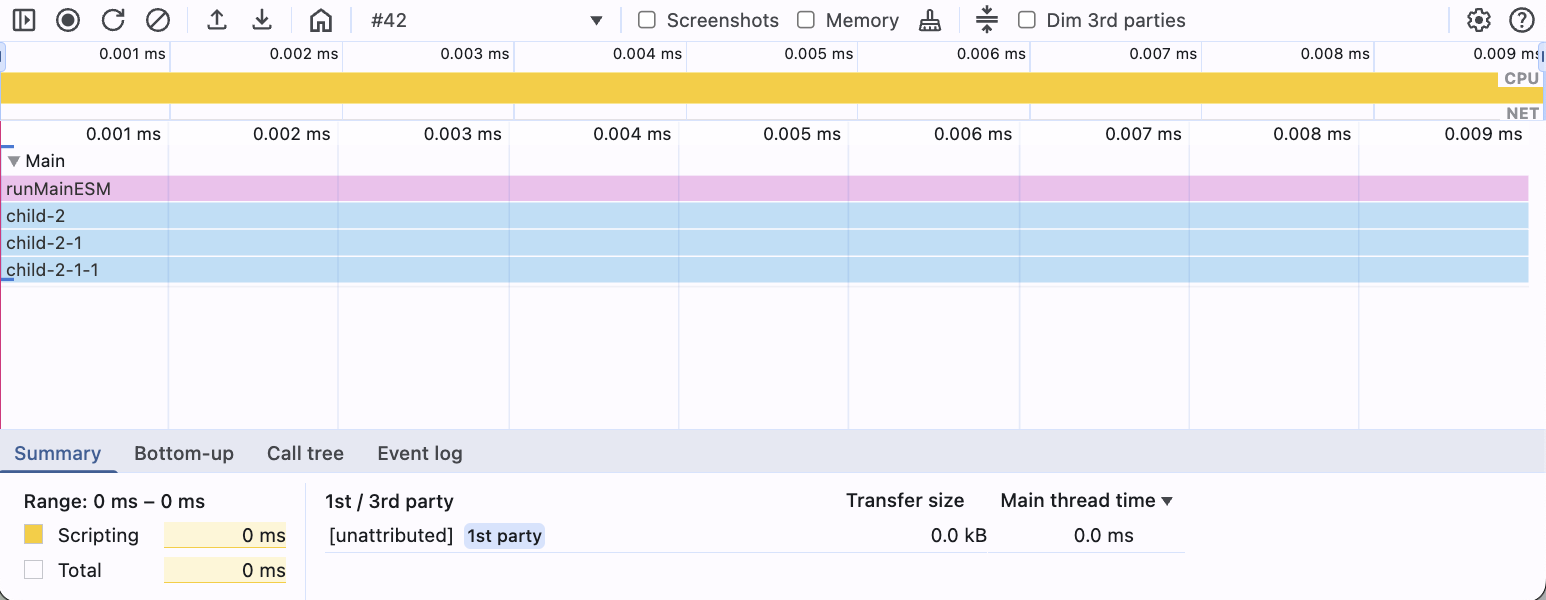
This view shows only part of the node tree. In the samplesparentchildren
A callFrame
type CallFrame = {
  // Name of the function being executed
  functionName: string;
  // Unique identifier for the script
  scriptId: string;
  // URL or path of the script file
  url: string;
  // Line number in the script
  lineNumber: number;
  // Column number in the script
  columnNumber: number;
};
The callFrame
functionName
url
scriptId
lineNumber
columnNumber
Profile: minimal-cpu-profile-nodes-call-frame-source-location.cpuprofile
{
  "nodes": [
    {
      "id": 1,
      "callFrame": {
        "functionName": "(root)",
        "scriptId": "0",
        "url": "",
        "lineNumber": -1,
        "columnNumber": -1
      },
      "children": [2]
    },
    {
      "id": 2,
      "callFrame": {
        "functionName": "work-1",
        "scriptId": "1",
        "url": "file:///1.js",
        "lineNumber": 92,
        "columnNumber": 19
      },
      "children": [3, 4]
    },
    {
      "id": 3,
      "callFrame": {
        "functionName": "child-work-1",
        "scriptId": "1",
        "url": "file:///1.js",
        "lineNumber": 12,
        "columnNumber": 34
      }
    },
    {
      "id": 4,
      "callFrame": {
        "functionName": "work-2",
        "scriptId": "2",
        "url": "file:///2.js",
        "lineNumber": 12,
        "columnNumber": 34
      }
    }
  ],
  "startTime": 1,
  "endTime": 40,
  "samples": [1, 3, 4, 1],
  "timeDeltas": [0, 10, 10, 10]
}
DevTools Performance Tab:
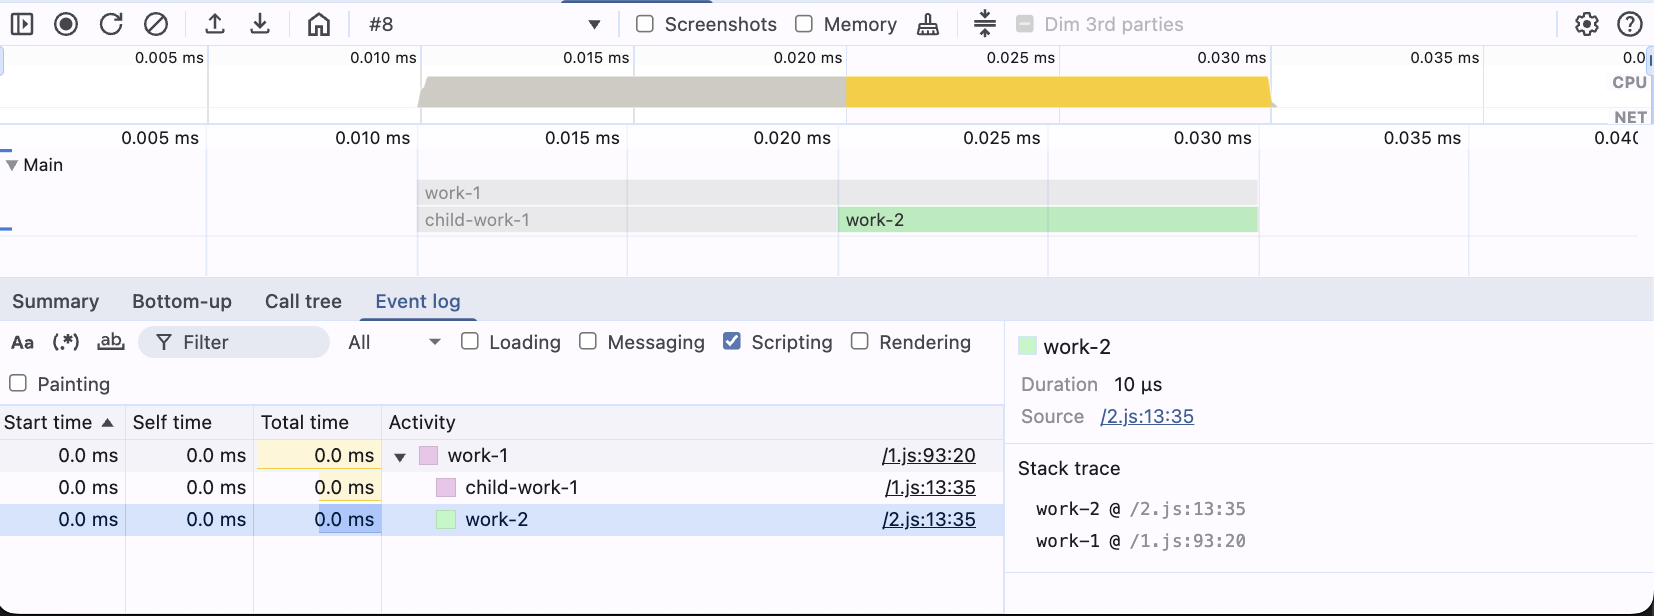
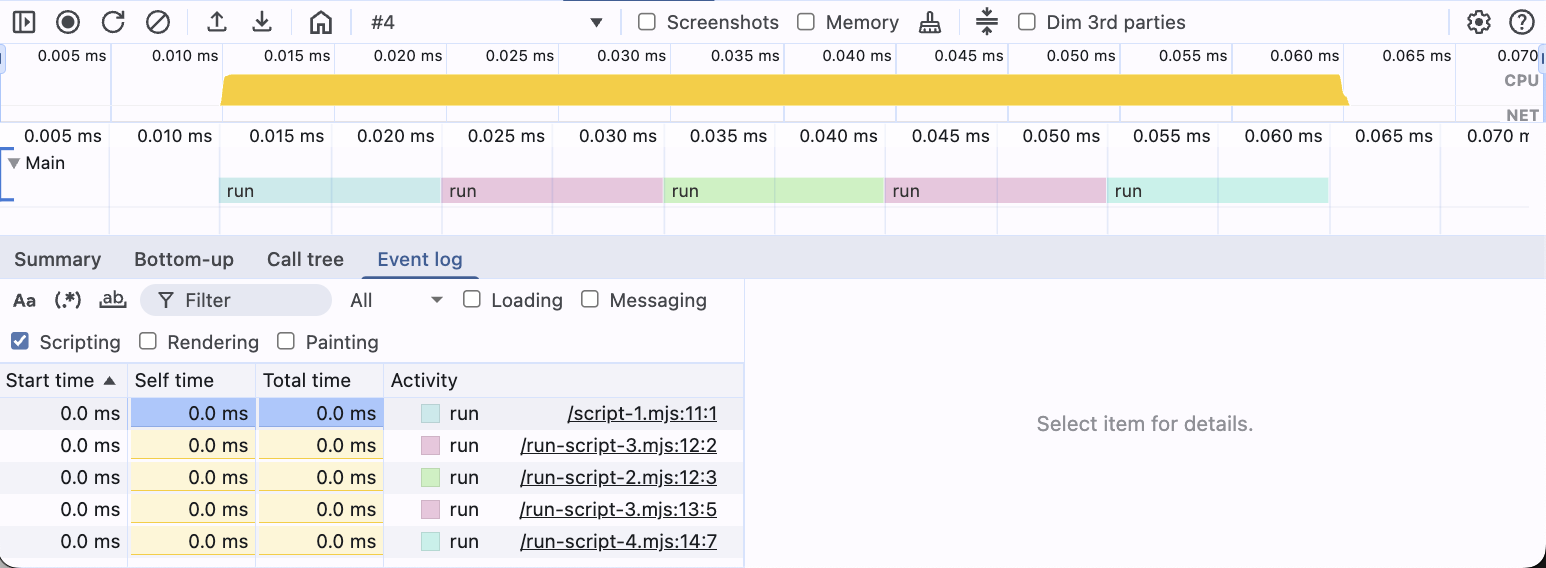
The urlcallFrame
Profile: minimal-cpu-profile-nodes-call-frame-url.cpuprofile
{
  "nodes": [
    {
      "id": 1,
      "callFrame": {
        "functionName": "(root)",
        "scriptId": "0",
        "url": "",
        "lineNumber": -1,
        "columnNumber": -1
      },
      "children": [2, 3, 4, 5, 6]
    },
    {
      "id": 2,
      "callFrame": {
        "functionName": "run",
        "scriptId": "2",
        "url": "file:///script-1.mjs",
        "lineNumber": 10,
        "columnNumber": 0
      },
      "parent": 1
    },
    {
      "id": 3,
      "callFrame": {
        "functionName": "run",
        "scriptId": "2",
        "url": "file:///run-script-3.mjs",
        "lineNumber": 11,
        "columnNumber": 1
      },
      "parent": 1
    },
    {
      "id": 4,
      "callFrame": {
        "functionName": "run",
        "scriptId": "2",
        "url": "file:///run-script-2.mjs",
        "lineNumber": 11,
        "columnNumber": 2
      },
      "parent": 1
    },
    {
      "id": 5,
      "callFrame": {
        "functionName": "run",
        "scriptId": "2",
        "url": "file:///run-script-3.mjs",
        "lineNumber": 12,
        "columnNumber": 4
      },
      "parent": 1
    },
    {
      "id": 6,
      "callFrame": {
        "functionName": "run",
        "scriptId": "2",
        "url": "file:///run-script-4.mjs",
        "lineNumber": 13,
        "columnNumber": 6
      },
      "parent": 1
    }
  ],
  "startTime": 1,
  "endTime": 70,
  "samples": [1, 2, 3, 4, 5, 6],
  "timeDeltas": [0, 10, 10, 10, 10, 10]
}
DevTools Performance Tab:
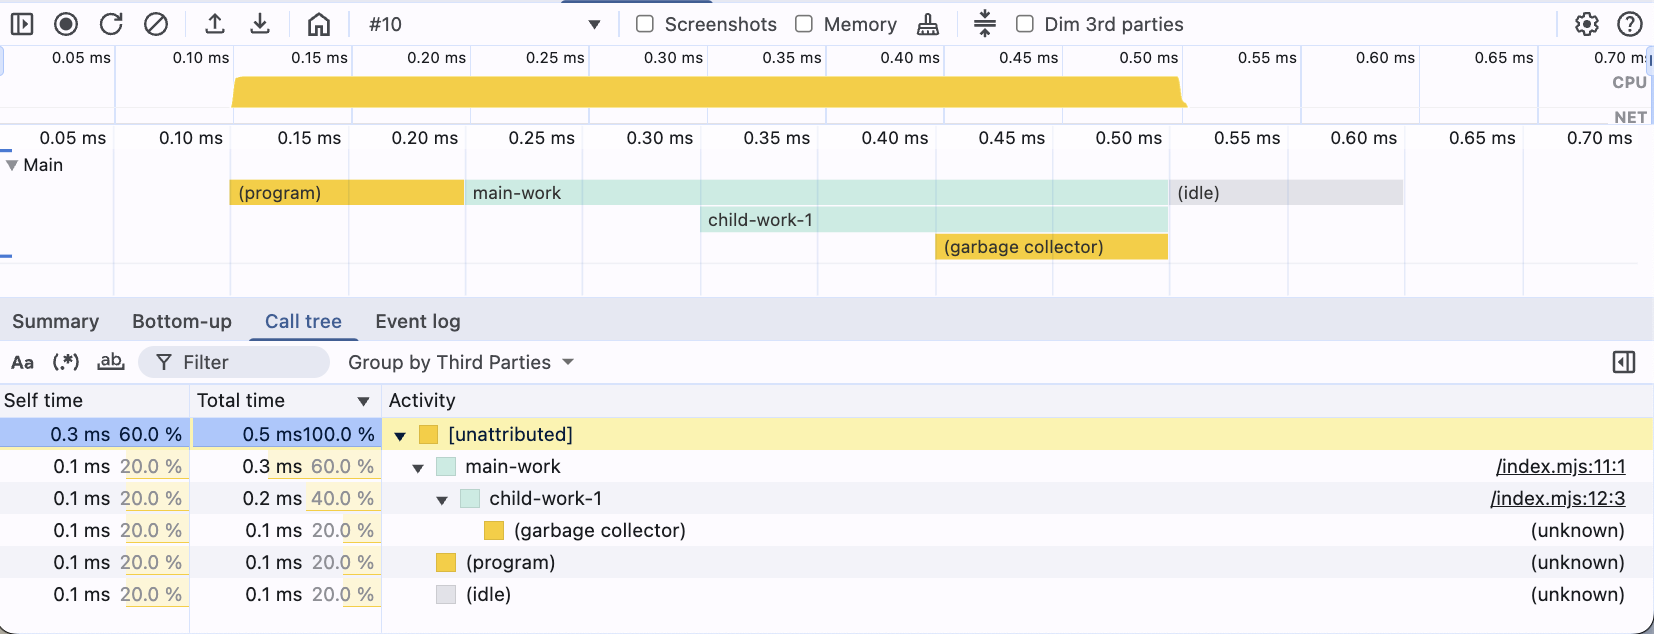
Synthetic frames are not actual lines from your code but markers added by the V8 engine (the JavaScript engine in Chrome and Node.js). These frames provide important context about the execution environment and system-level operations.
A synthetic frame has functionNamescriptId"0"url""lineNumbercolumnNumber-1
What they represent:
Frame Name | What It Means |
|---|---|
| The very start of the profile session (entry point) |
| Your top-level script (code not inside any function) |
| Time when nothing is happening — app is waiting |
| Time spent cleaning memory — V8 is reclaiming RAM |
Profile: minimal-cpu-profile-nodes-call-frame-synthetic-frames.cpuprofile
{
  "nodes": [
    {
      "id": 1,
      "callFrame": {
        "functionName": "(root)",
        "scriptId": "0",
        "url": "",
        "lineNumber": -1,
        "columnNumber": -1
      },
      "children": [2, 3, 5, 6]
    },
    {
      "id": 2,
      "callFrame": {
        "functionName": "(program)",
        "scriptId": "0",
        "url": "",
        "lineNumber": -1,
        "columnNumber": -1
      },
      "children": []
    },
    {
      "id": 3,
      "callFrame": {
        "functionName": "main-work",
        "scriptId": "2",
        "url": "file:///index.mjs",
        "lineNumber": 10,
        "columnNumber": 0
      },
      "children": [4]
    },
    {
      "id": 4,
      "callFrame": {
        "functionName": "child-work-1",
        "scriptId": "2",
        "url": "file:///index.mjs",
        "lineNumber": 11,
        "columnNumber": 2
      }
    },
    {
      "id": 5,
      "callFrame": {
        "functionName": "(garbage collector)",
        "scriptId": "0",
        "url": "",
        "lineNumber": -1,
        "columnNumber": -1
      },
      "children": []
    },
    {
      "id": 6,
      "callFrame": {
        "functionName": "(idle)",
        "scriptId": "0",
        "url": "",
        "lineNumber": -1,
        "columnNumber": -1
      },
      "children": []
    }
  ],
  "startTime": 1,
  "endTime": 700,
  "samples": [1, 2, 3, 4, 5, 6],
  "timeDeltas": [0, 100, 100, 100, 100, 100]
}
DevTools Performance Tab:
Demystifying the core data structures behind CPU profiles is an important step toward effective performance analysis in Chrome DevTools. With this knowledge, you will find it easier to read and use actual profiling output in your daily work. The next article will show these concepts in action with real-world profiling examples and hands-on analysis.
If you need expert help with profiling or a full performance audit, our team is here to assist.
Advanced workshop
High-Speed Angular applications on any device
Learn more
Profiling is easiest when it's real. Learn how to capture and make sense of CPU profiles in Node.js across scripts, threads, and processes—then apply it to your own projects.


Part 2 is a practical walkthrough to diagnose and speed up LCP. Learn to read CrUX trends, profile in Chrome DevTools, preload critical assets, use srcset, defer third-party scripts, and code-split Angular bundles to turn red LCP into green.


Accessibility doesn’t have to be hard. Follow a comic-style, hands-on journey building an accessible day selector with Angular Aria, learning comboboxes, listboxes, and real screen reader behavior along the way.

Largest Contentful Paint (LCP) is a Core Web Vital that shapes user perception of speed. This first part explains what LCP is why it matters for SEO and business, and how its phases affect site performance.
Get deeper insights into your Node.JS performance. Learn how to master advanced CPU profiling with built-in tools, interpret process/thread IDs, and optimize using sampling intervals. Troubleshooting and real examples included.

Implement incremental hydration in a real-world Angular app - Basic setup, hydration triggers and important considerations for a seamless integration.