
Advanced workshop
Architecting Angular Apps for High Performance
High-Speed Angular applications on any device
Learn more
CPU profiling is a powerful but intricate part of optimizing Node.js application performance. While it is easy to get started with the basics, using profiling effectively requires a deeper understanding of the available tools, how they work, and what the results mean. This article introduces advanced CPU profiling techniques using Node.js’s built-in tools. You will learn how to create CPU profiles, troubleshoot common issues, manage and interpret profiling data, and adjust profiling arguments for different scenarios. With practical examples and detailed explanations throughout, you will gain the confidence you need to analyze and improve your application's performance.
To create a CPU profile, you can use the --cpu-prof.cpuprofile
Official docs: Node.js CPU Profiling
node --cpu-prof -e "console.log('CPU')"
NODE_OPTIONS="--cpu-prof" node -e "console.log('CPU')"
☝️ Note
The order of CPU profiling arguments is critical!
❌ Bad:
# This will NOT create a CPU profile file.
node script.js --cpu-prof
✅ Good:
# This will create a CPU profile file under CWD.
node --cpu-prof script.js
Based on the file naming conventions and the nature of process ID assignment, the main process always has the smallest Process ID (PID), and a Thread ID (TID) is 0 and appears at the end of an alphabetically sorted folder. The main process is the last file in the folder.
This is because of the way Node.js handles the --cpu-prof--cpu-prof-dir
/root
├── CPU.20250601.191007.42154.0.001.cpuprofile
└── packages
    ├── pak1
    │   └── CPU.20250601.191007.42154.0.003.cpuprofile
    ├── pak2
    │   └── src
    │       └── lib
    │           └── CPU.20250601.191007.42154.0.002.cpuprofile
    └── pak3
        └── CPU.20250601.191007.42154.0.004.cpuprofile
Now all of them are in one place:
# Linux
node --cpu-prof --cpu-prof-dir=/Users/username/reponame/profiles -e "console.log('CPU')"
# Windows
node --cpu-prof --cpu-prof-dir=C:\Users\username\reponame\profiles -e "console.log('CPU')"
/root
└── profiles
    ├── CPU.20250601.191007.42154.0.001.cpuprofile
    ├── CPU.20250601.191007.42154.0.002.cpuprofile
    ├── CPU.20250601.191007.42154.0.003.cpuprofile
    └── CPU.20250601.191007.42154.0.004.cpuprofile
--cpu-prof is not allowed in NODE_OPTIONSNode.js maintains a security whitelist for NODE_OPTIONS
≤ v22.x: All CPU profiling flags blocked in NODE_OPTIONS
≥ v23.x: All CPU profiling flags allowed (PR #57018)
NODE_OPTIONS="--cpu-prof" node -e "console.log('test')" 2>/dev/null && echo "✅ Supported"
|| echo "❌ Not supported"
# Use the patch script. This will start profiling for every tread programatically.
node --require ./cpu-prof.js -e "console.log('CPU')"
┌────────────────────────────────────────────────────────────┐
│  CPU.20250510.134625.51430.0.001.cpuprofile                │
│      │        │      │     │   │                           │
│      │        │      │     │   └────── %N = Sequence (001) ┘
│      │        │      │     └────────── %T = Thread ID (0)
│      │        │      └──────────────── %P = Process ID (51430)
│      │        └─────────────────────── %H = Time (134625 → 13:46:25)
│      └──────────────────────────────── %D = Start Date (20250510 → May 10, 2025)
└─────────────────────────────────────── Fixed prefix = "CPU"
The date and time in the filename represent the wall-clock write time, which is when the profile was flushed. This timestamp generally corresponds to the process creation time, not the moment the file was written to the file system.
The CPU profile filename includes both a Process ID (PID) and a Thread ID (TID). Understanding how these IDs are generated is crucial for interpreting profile files, especially in applications involving multiple processes or worker threads.
A Node.js application starts as a single process. This main process can then spawn child processes or create worker threads. Each new process and worker thread is assigned a distinct ID, which is reflected in the CPU profile filenames. Node.js provides built-in mechanisms for accessing these identifiers. For instance, process.pidworker_threads.threadIdthreadId
The following script demonstrates how to retrieve these values:
node -p "const { threadId } = require('node:worker_threads'); 'PID: ' + process.pid + ',
TID: ' + threadId"
Output:
PID: 51430 TID: 0
The PID represents the OS-level process ID.
A new PID is generated each time a new process is created. Common ways to create new processes in Node.js include:
child_process.fork()
child_process.spawn()
child_process.exec()
Directly running the node
Consider the following script that spawns two child processes:
NODE_OPTIONS="--cpu-prof" node -e "
const { spawn } = require('child_process');
const { threadId: t } = require('worker_threads');
const cs = \"const { threadId: t } = require('worker_threads');
console.log('spawn PID:',
process.pid, 'TID:', t);\";
spawn(process.execPath, ['-e', cs], { stdio: 'inherit' });
spawn(process.execPath, ['-e', cs], { stdio: 'inherit' });
console.log('Parent PID:' , process.pid, 'TID:', t);
"
Output (order of spawn children may vary slightly due to asynchronous nature):
Parent PID: 51430 TID: 0 spawn PID: 51431 TID: 0 spawn PID: 51432 TID: 0
☝️ Note: The process ID
is assigned incrementally. The initial process is always the smallest PID and TID is 0. process.pid
If --cpu-profnode --cpu-prof script.js
CPU.<timestamp>.51430.0.001.cpuprofile
CPU.<timestamp>.51431.0.002.cpuprofile
CPU.<timestamp>.51432.0.003.cpuprofile
The TID represents V8's internal thread identifier.
By default, Node.js applications run in a single main thread, which typically has a TID of 0Workernode:worker_threads
The following script creates two worker threads:
NODE_OPTIONS="--cpu-prof" node -e "
const { Worker, threadId, isMainThread } = require('worker_threads');
const workerScript = \"const { threadId: t } = require('worker_threads');
console.log('Worker PID:', process.pid, 'TID:', t);\";
new Worker(workerScript, { eval: true });
new Worker(workerScript, { eval: true });
console.log('Main PID:', process.pid, 'TID:', threadId);
"
Output (order of worker messages may vary):
Main PID: 51430  TID: 0 Worker PID: 51430  TID: 1 (Worker 1) Worker PID: 51430
TID: 2 (Worker 2)
If --cpu-prof
CPU.<timestamp>.51430.0.001.cpuprofile
CPU.<timestamp>.51430.1.002.cpuprofile
CPU.<timestamp>.51430.2.003.cpuprofile
The sequence number (.001.002
☝️ Note: The "Added in" versions indicate when these flags were introduced. Some flags were initially experimental. Always consult the official Node.js documentation for the most current information on their status and behavior in your Node.js version.
Flag | Added in | Default | Description |
| v12.0.0 (Exp) | off | Starts the V8 CPU profiler on startup and writes a .cpuprofile on exit. |
| v12.0.0 (Exp) | Current working directory. If | Directory where |
| v12.0.0 (Exp) |
| Filename to use for the CPU profile. |
| v12.2.0 (Exp) |
| Sampling interval in microseconds for the CPU profiler. |
--cpu-profPurpose: Starts the V8 CPU profiler on application startup. When the Node.js process exits, a .cpuprofile
Default: off
Usage Example:
node --cpu-prof -e "console.log('CPU')"
This command will profile and generate a profile file (e.g., CPU.<timestamp>.<pid>.<tid>.<sequence>.cpuprofile
--cpu-prof-dirPurpose: Specifies the directory where CPU profile files generated by --cpu-prof
Default: The current working directory. If --diagnostic-dir
Usage Example:
node --cpu-prof --cpu-prof-dir=./profiles -e "console.log('CPU')"
This will save the CPU profile into the ./profiles
Notes:
If --cpu-prof-name--cpu-prof-dir
Ensure the specified directory is writable by the Node.js process.
--cpu-prof-namePurpose: Specifies a custom filename for the generated CPU profile.
Default: CPU.<yyyymmdd>.<hhmmss>.<pid>.<tid>.<seq>.cpuprofile
Usage Example:
node --cpu-prof --cpu-prof-name="my-custom-profile.cpuprofile" -e "console.log('CPU')"
This will generate a profile file named my-custom-profile.cpuprofile--cpu-prof-dir
Notes:
You CANNOT use placeholders for filenames (e.g., ${pid}${timestamp}
If an absolute path is provided (e.g., /tmp/my-custom-profile.cpuprofile
--cpu-prof-intervalPurpose: Sets the sampling interval for the CPU profiler in microseconds (µs). This determines how frequently the profiler captures the state of the JavaScript call stack.
Default: 1000
Usage Example:
node --cpu-prof --cpu-prof-interval=100 -e "console.log('CPU')"
This command profiles an inline script (console.log('CPU')
The --cpu-prof-interval
A smaller interval (e.g., 50 µs, 100 µs) collects more samples, providing a highly detailed profile. This is useful for short-running processes or identifying fine-grained bottlenecks. However, it results in larger .cpuprofile
A larger interval (e.g., 1000 µs, 5000 µs) collects fewer samples, resulting in smaller profile files and reduced overhead. This is suitable for longer-running processes or when a high-level overview of CPU usage is sufficient.
Start with the default (1000 µs) and adjust based on the granularity of data you need and the acceptable size of the generated profile files. The following section includes a table that illustrates the impact of different intervals on a sample application.
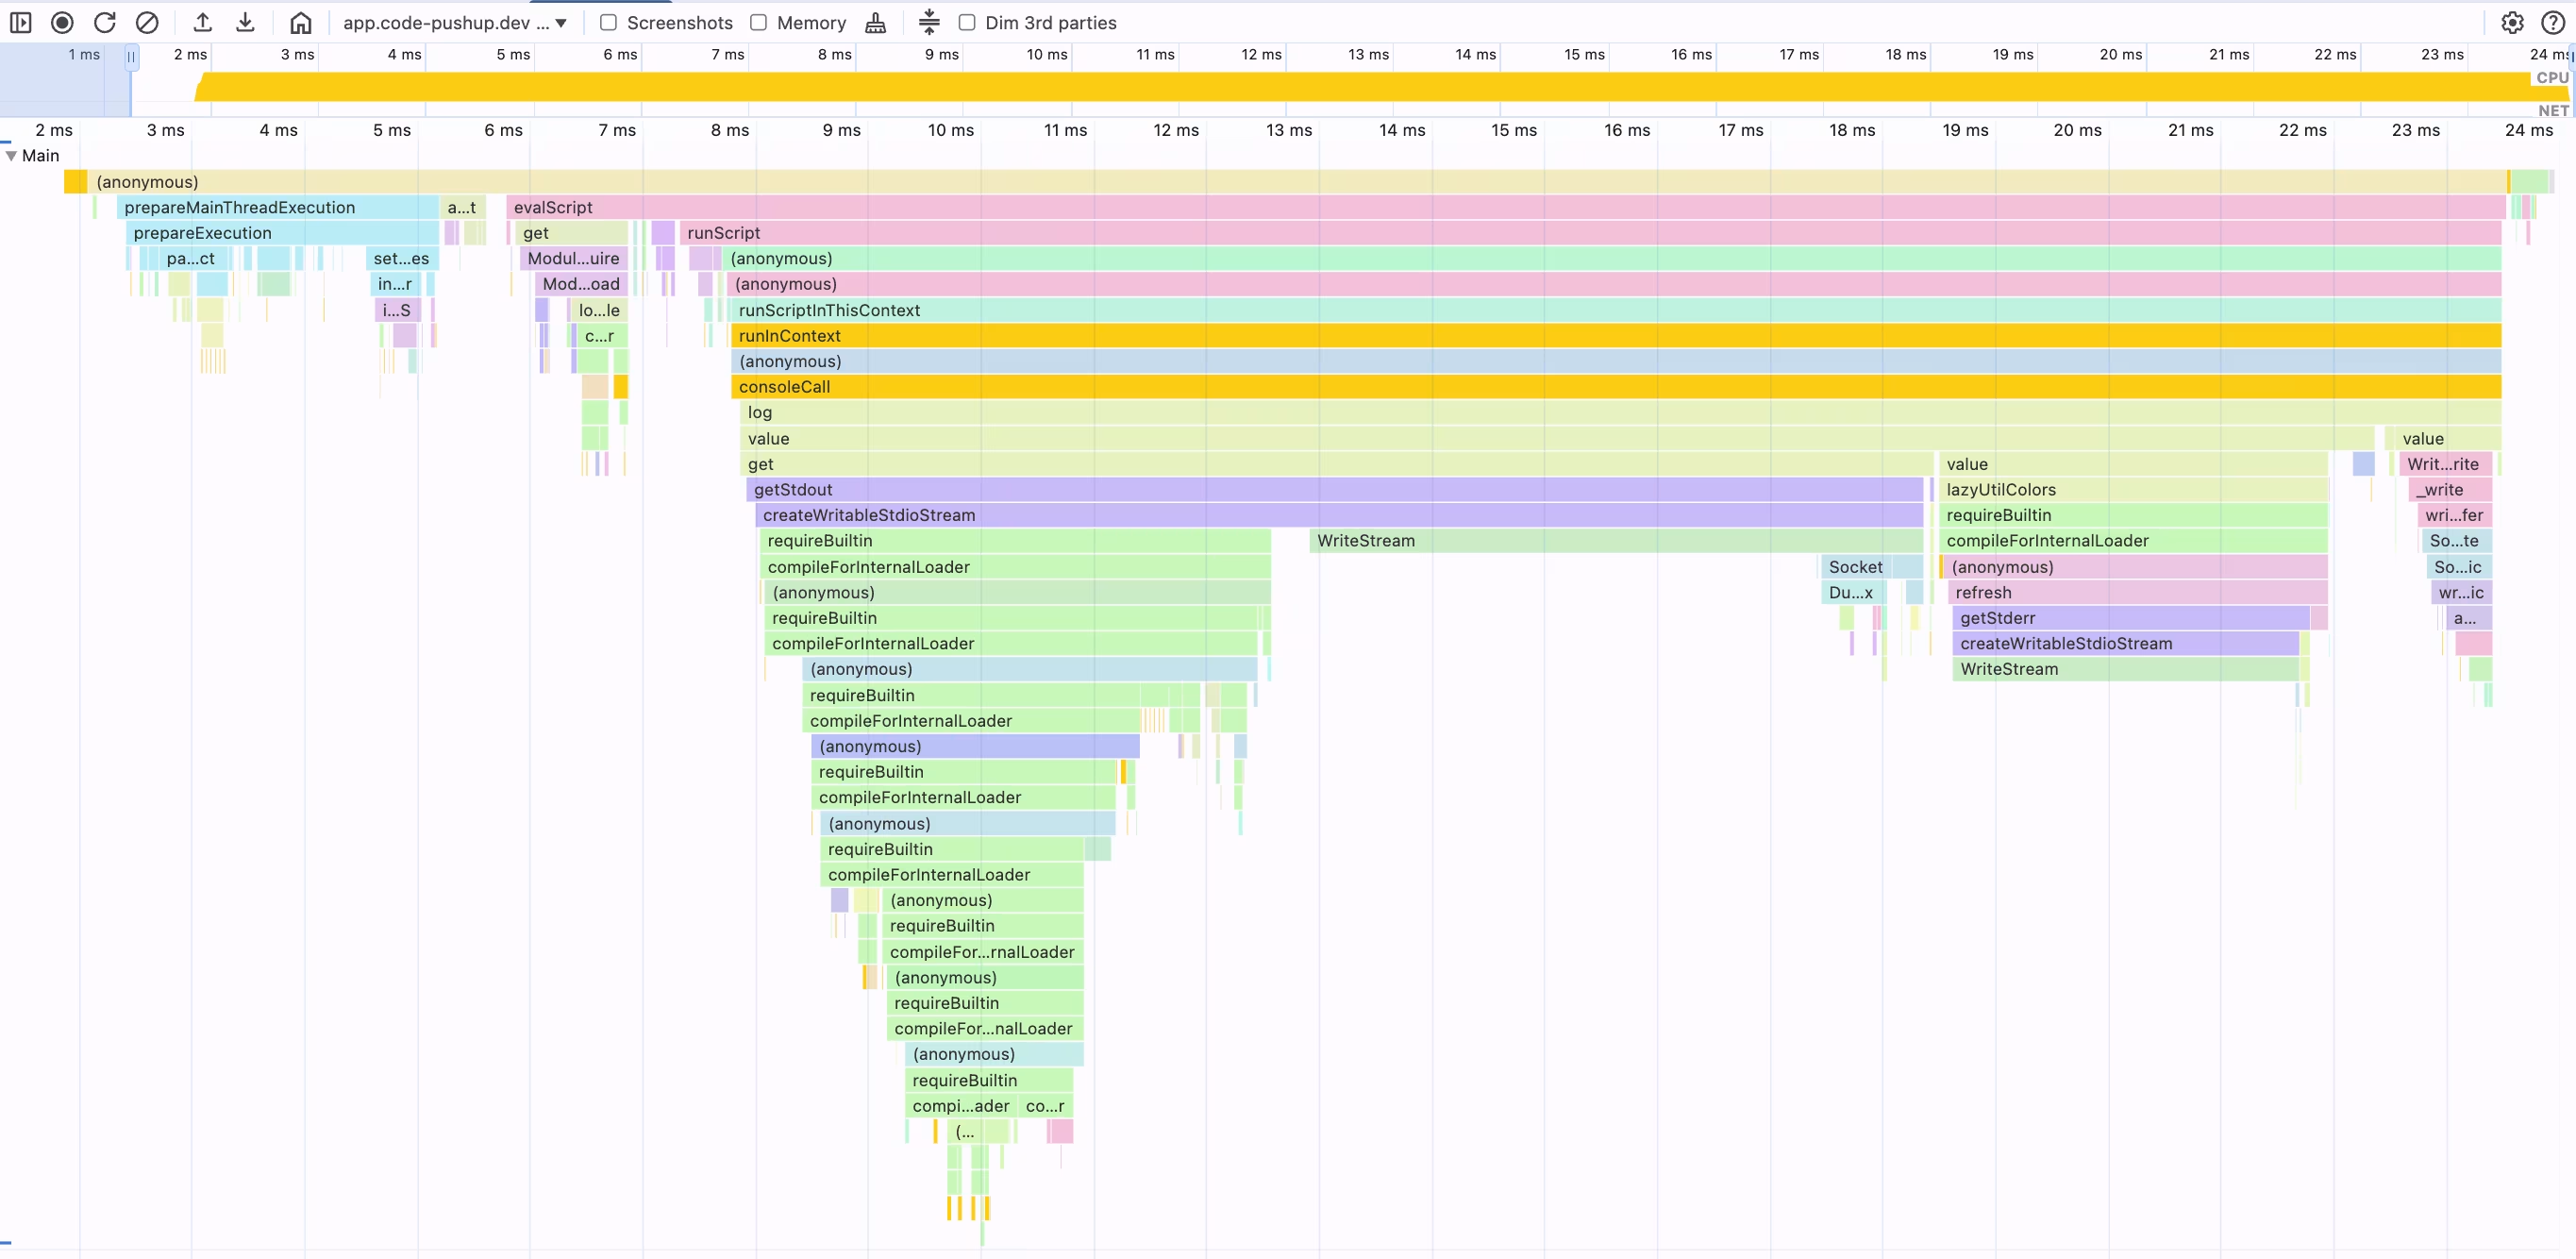
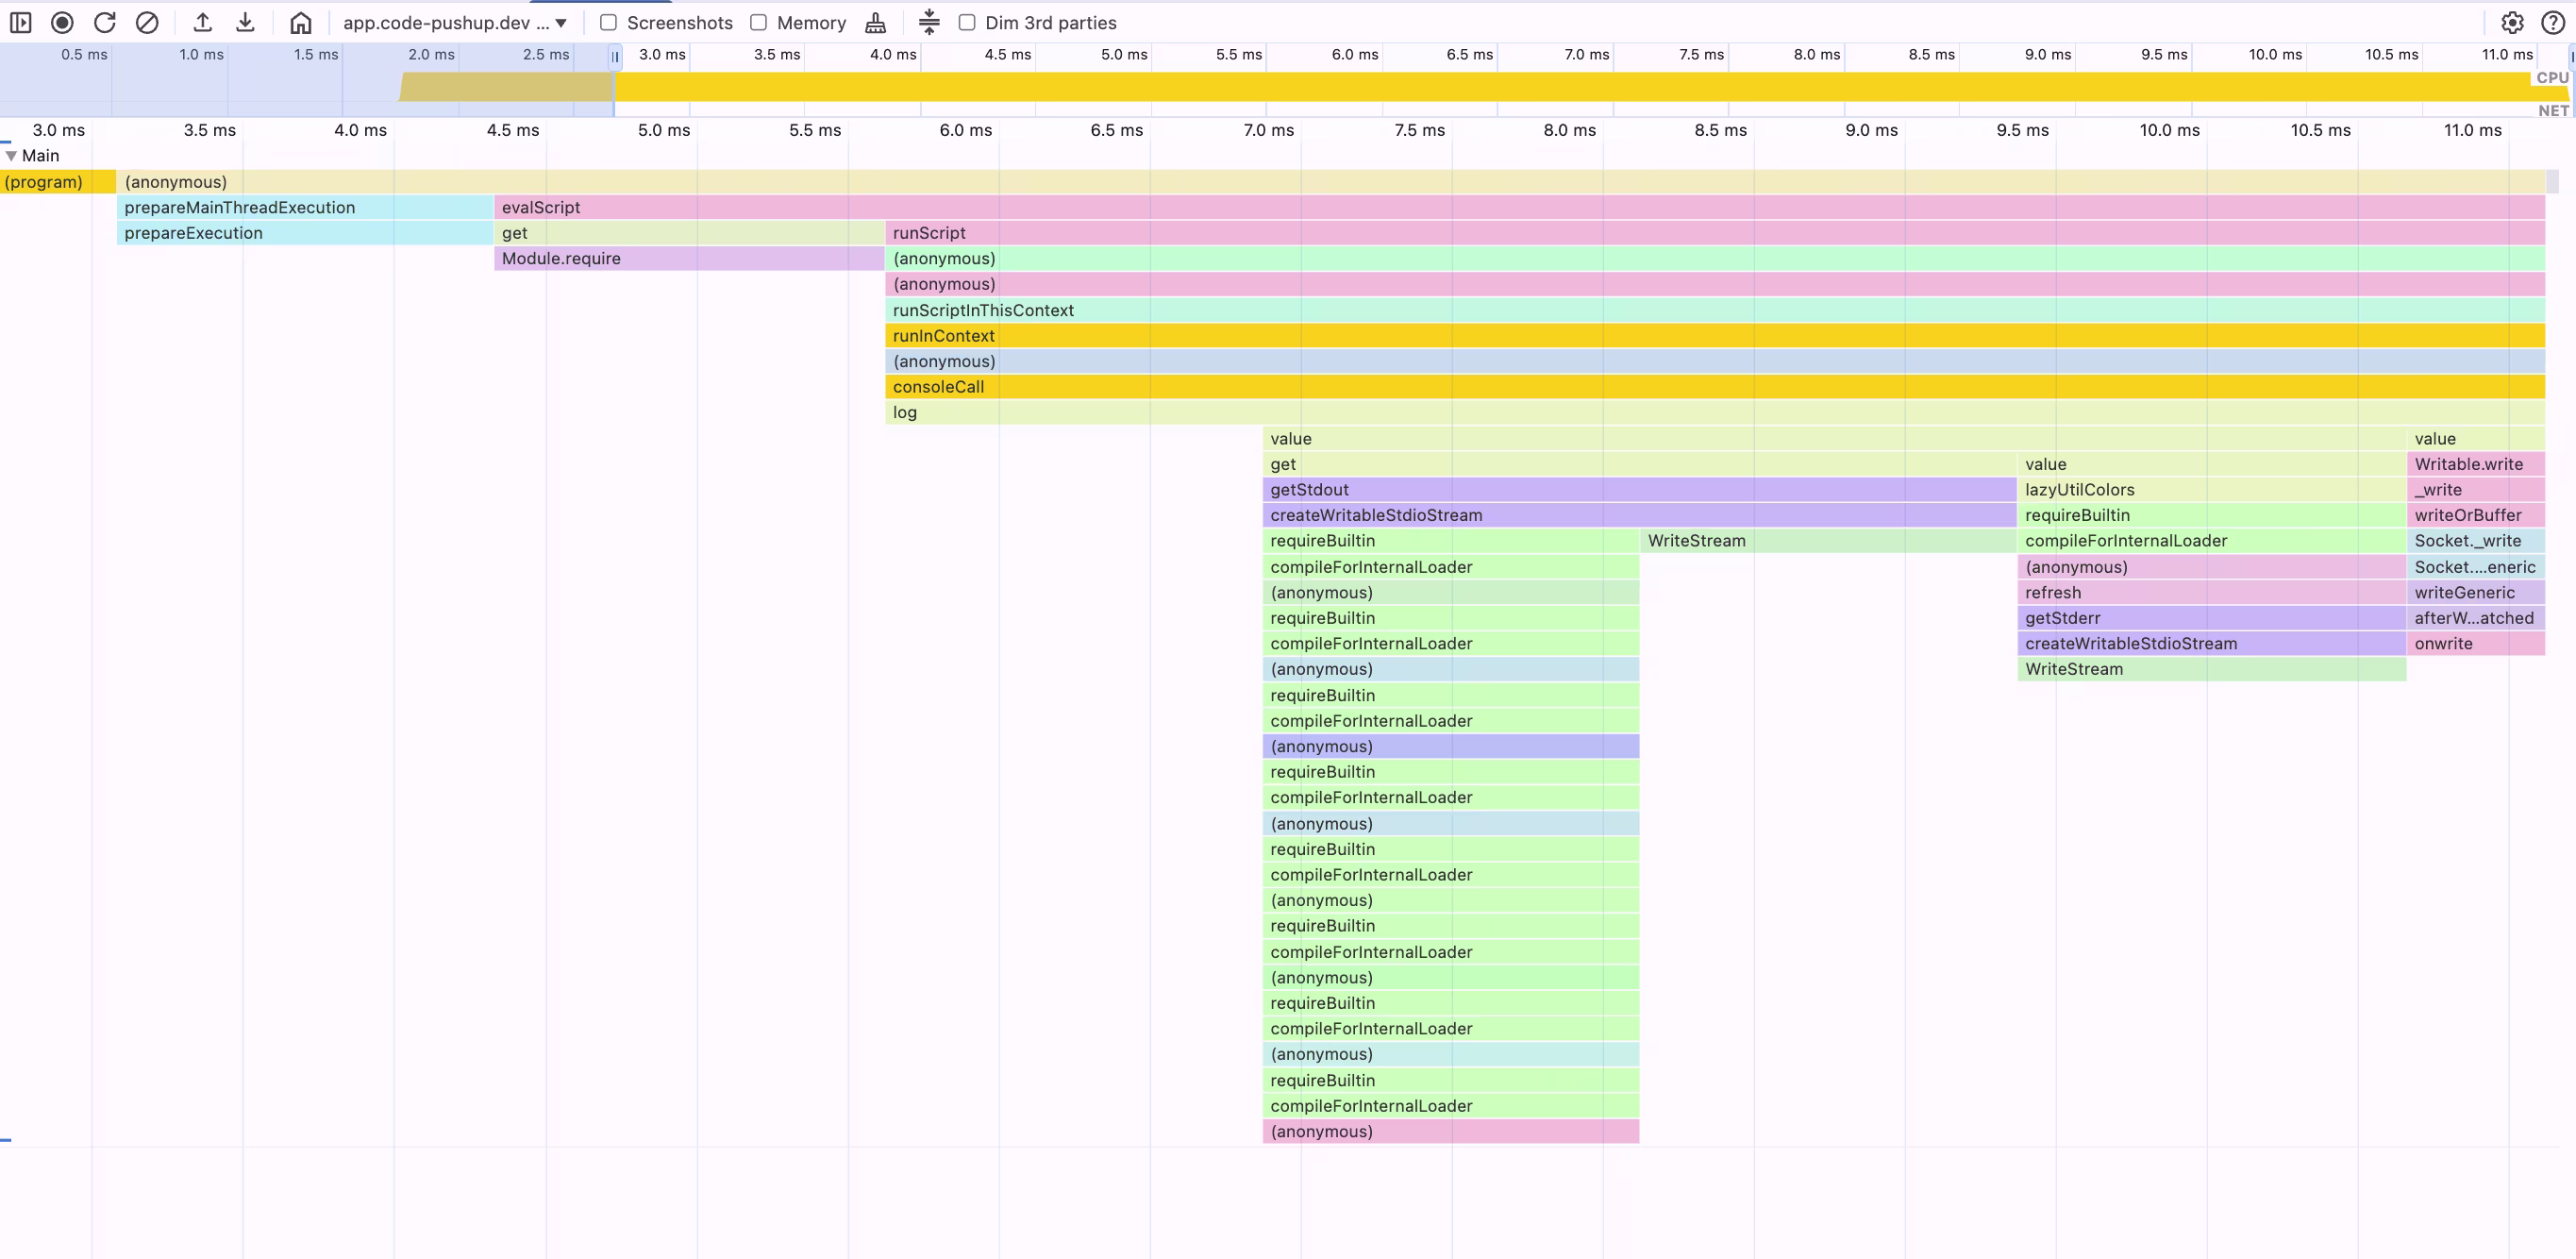
This example demonstrates how different --cpu-prof-interval
Run the following command to create profiles with intervals ranging from 1μs to 10,000μs:
for interval in 1 10 50 100 1000 2000 3000 4000 5000 6000 7000 10000; do
  echo "Profiling with interval: ${interval}μs" && \
  node --cpu-prof \
       --cpu-prof-interval=${interval} \
       --cpu-prof-dir=./profiles \
       --cpu-prof-name="interval${interval}.cpuprofile" \
       -e "console.log('Hello CPU Profile with ${interval}μs interval!')"
done
Use this command to compare the profiles and display their characteristics:
node -e "
const fs = require('fs');
console.table(fs.readdirSync('./profiles')
  .filter(f => f.endsWith('.cpuprofile'))
  .map(f => {
    let j = JSON.parse(fs.readFileSync('./profiles/' + f));
    let s = fs.statSync('./profiles/' + f);
    let i = f.match(/\d+/)?.[0] || '?';
    let d = ((j.endTime - j.startTime) / 1e3).toFixed(1);
    return {
      File: f,
      Interval: i + 'μs',
      Duration: d + 'ms',
      Nodes: j.nodes.length,
      Samples: j.samples.length,
      'Size(KB)': (s.size / 1024).toFixed(1)
    };
  }));
"
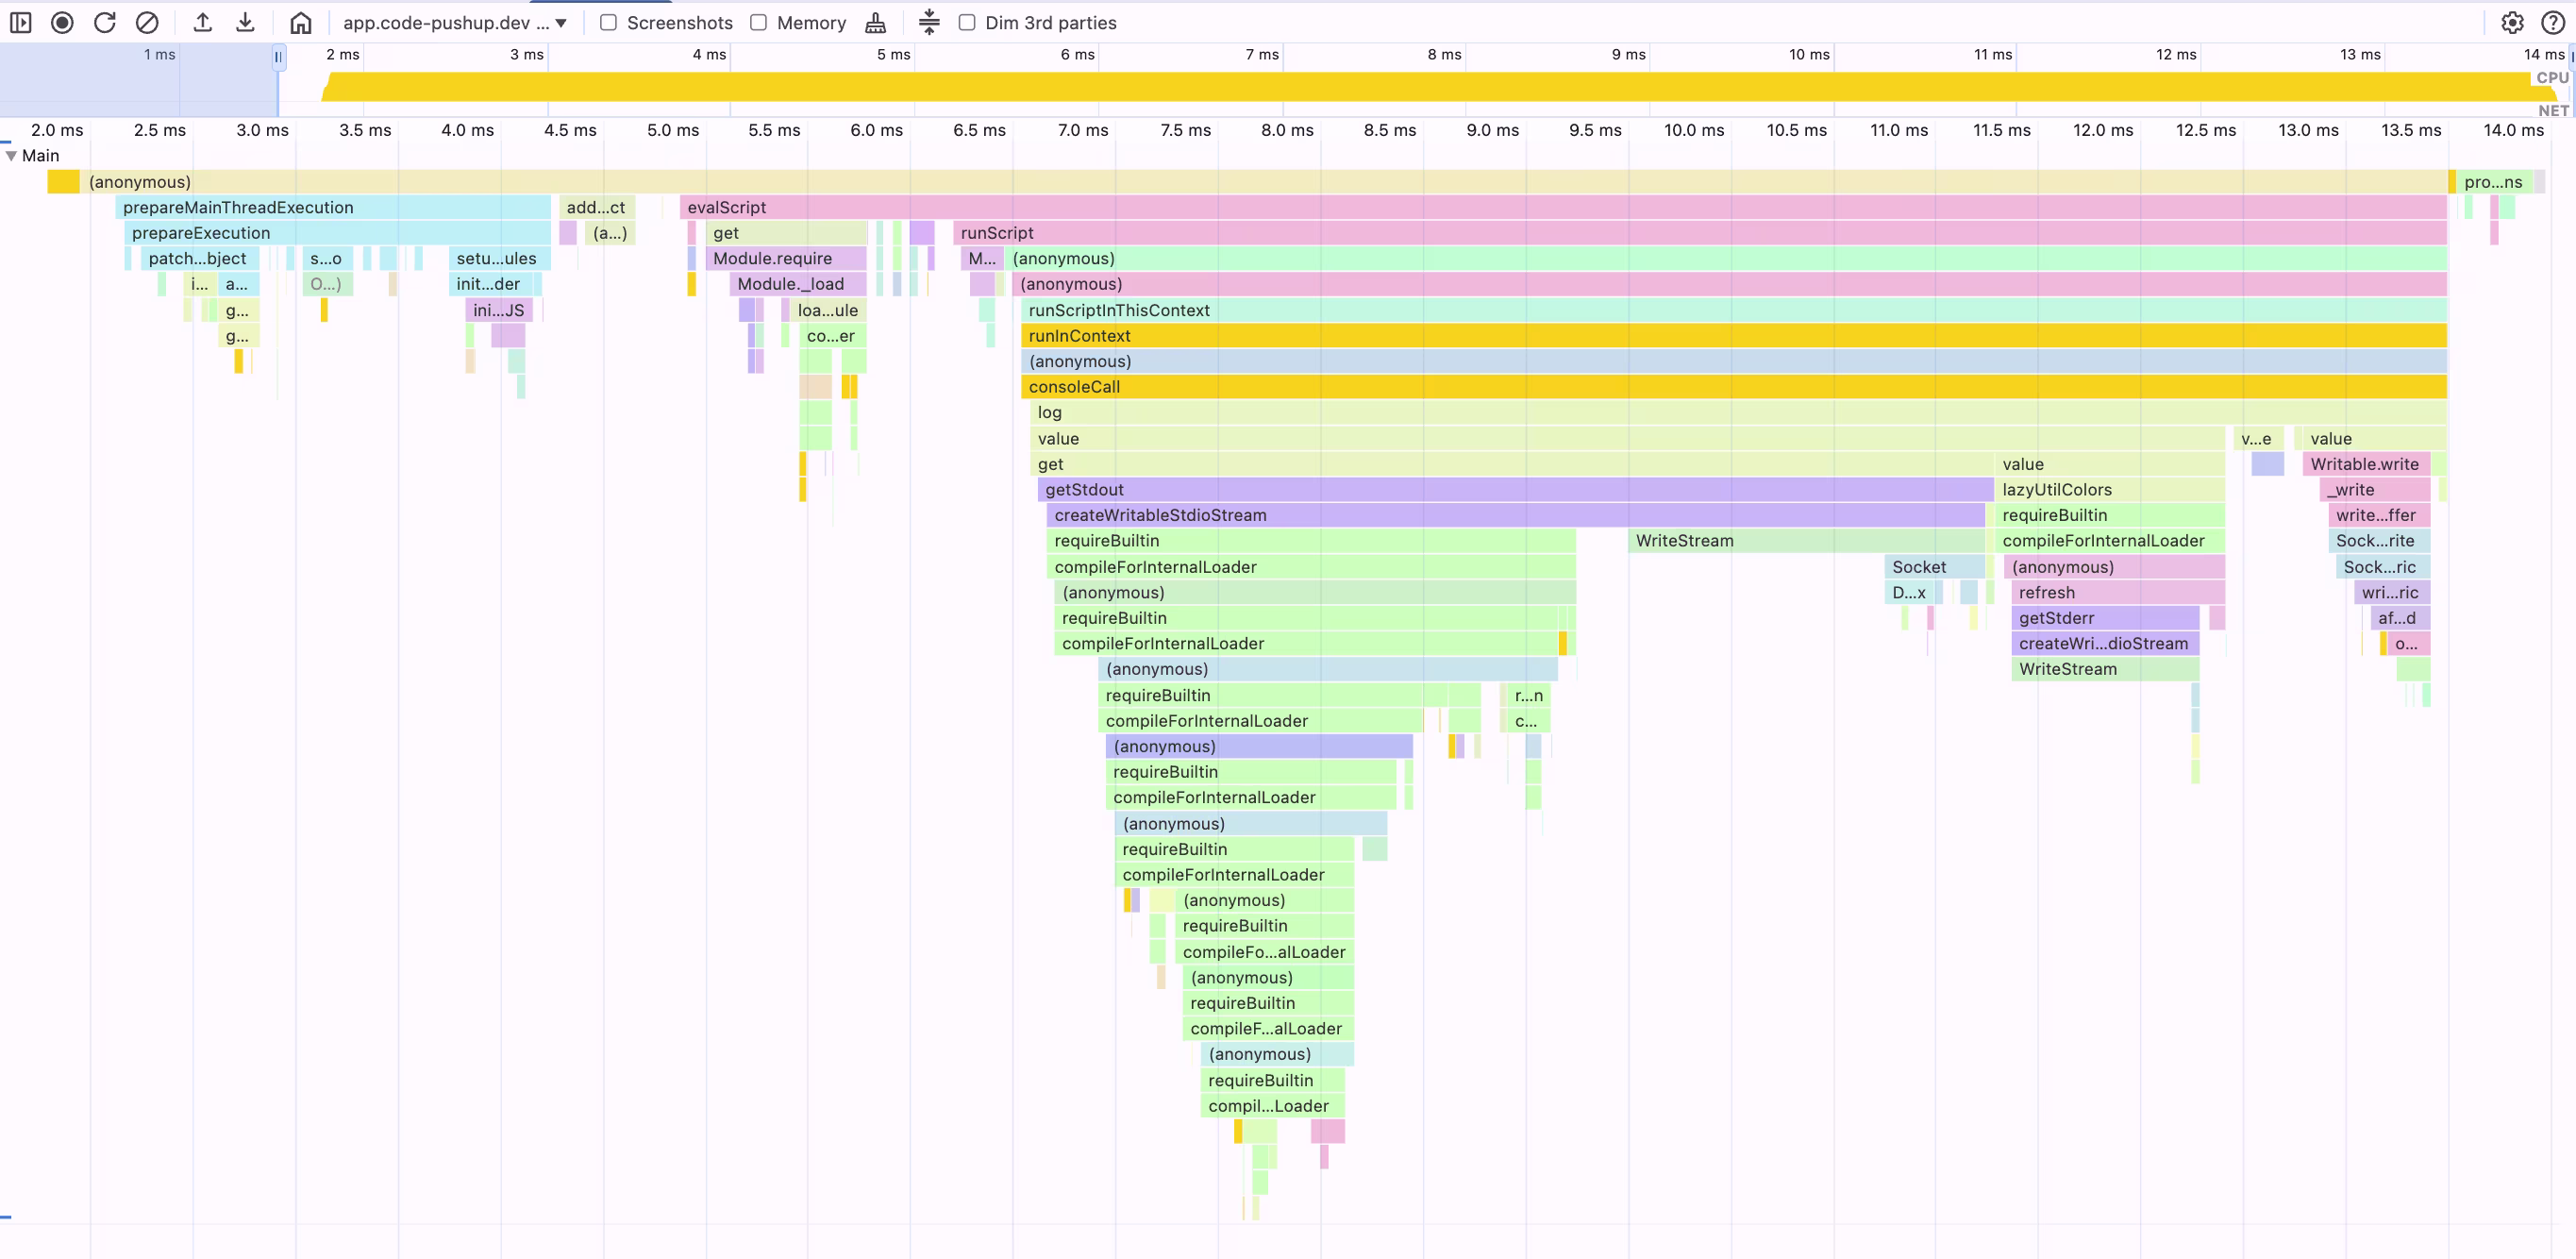
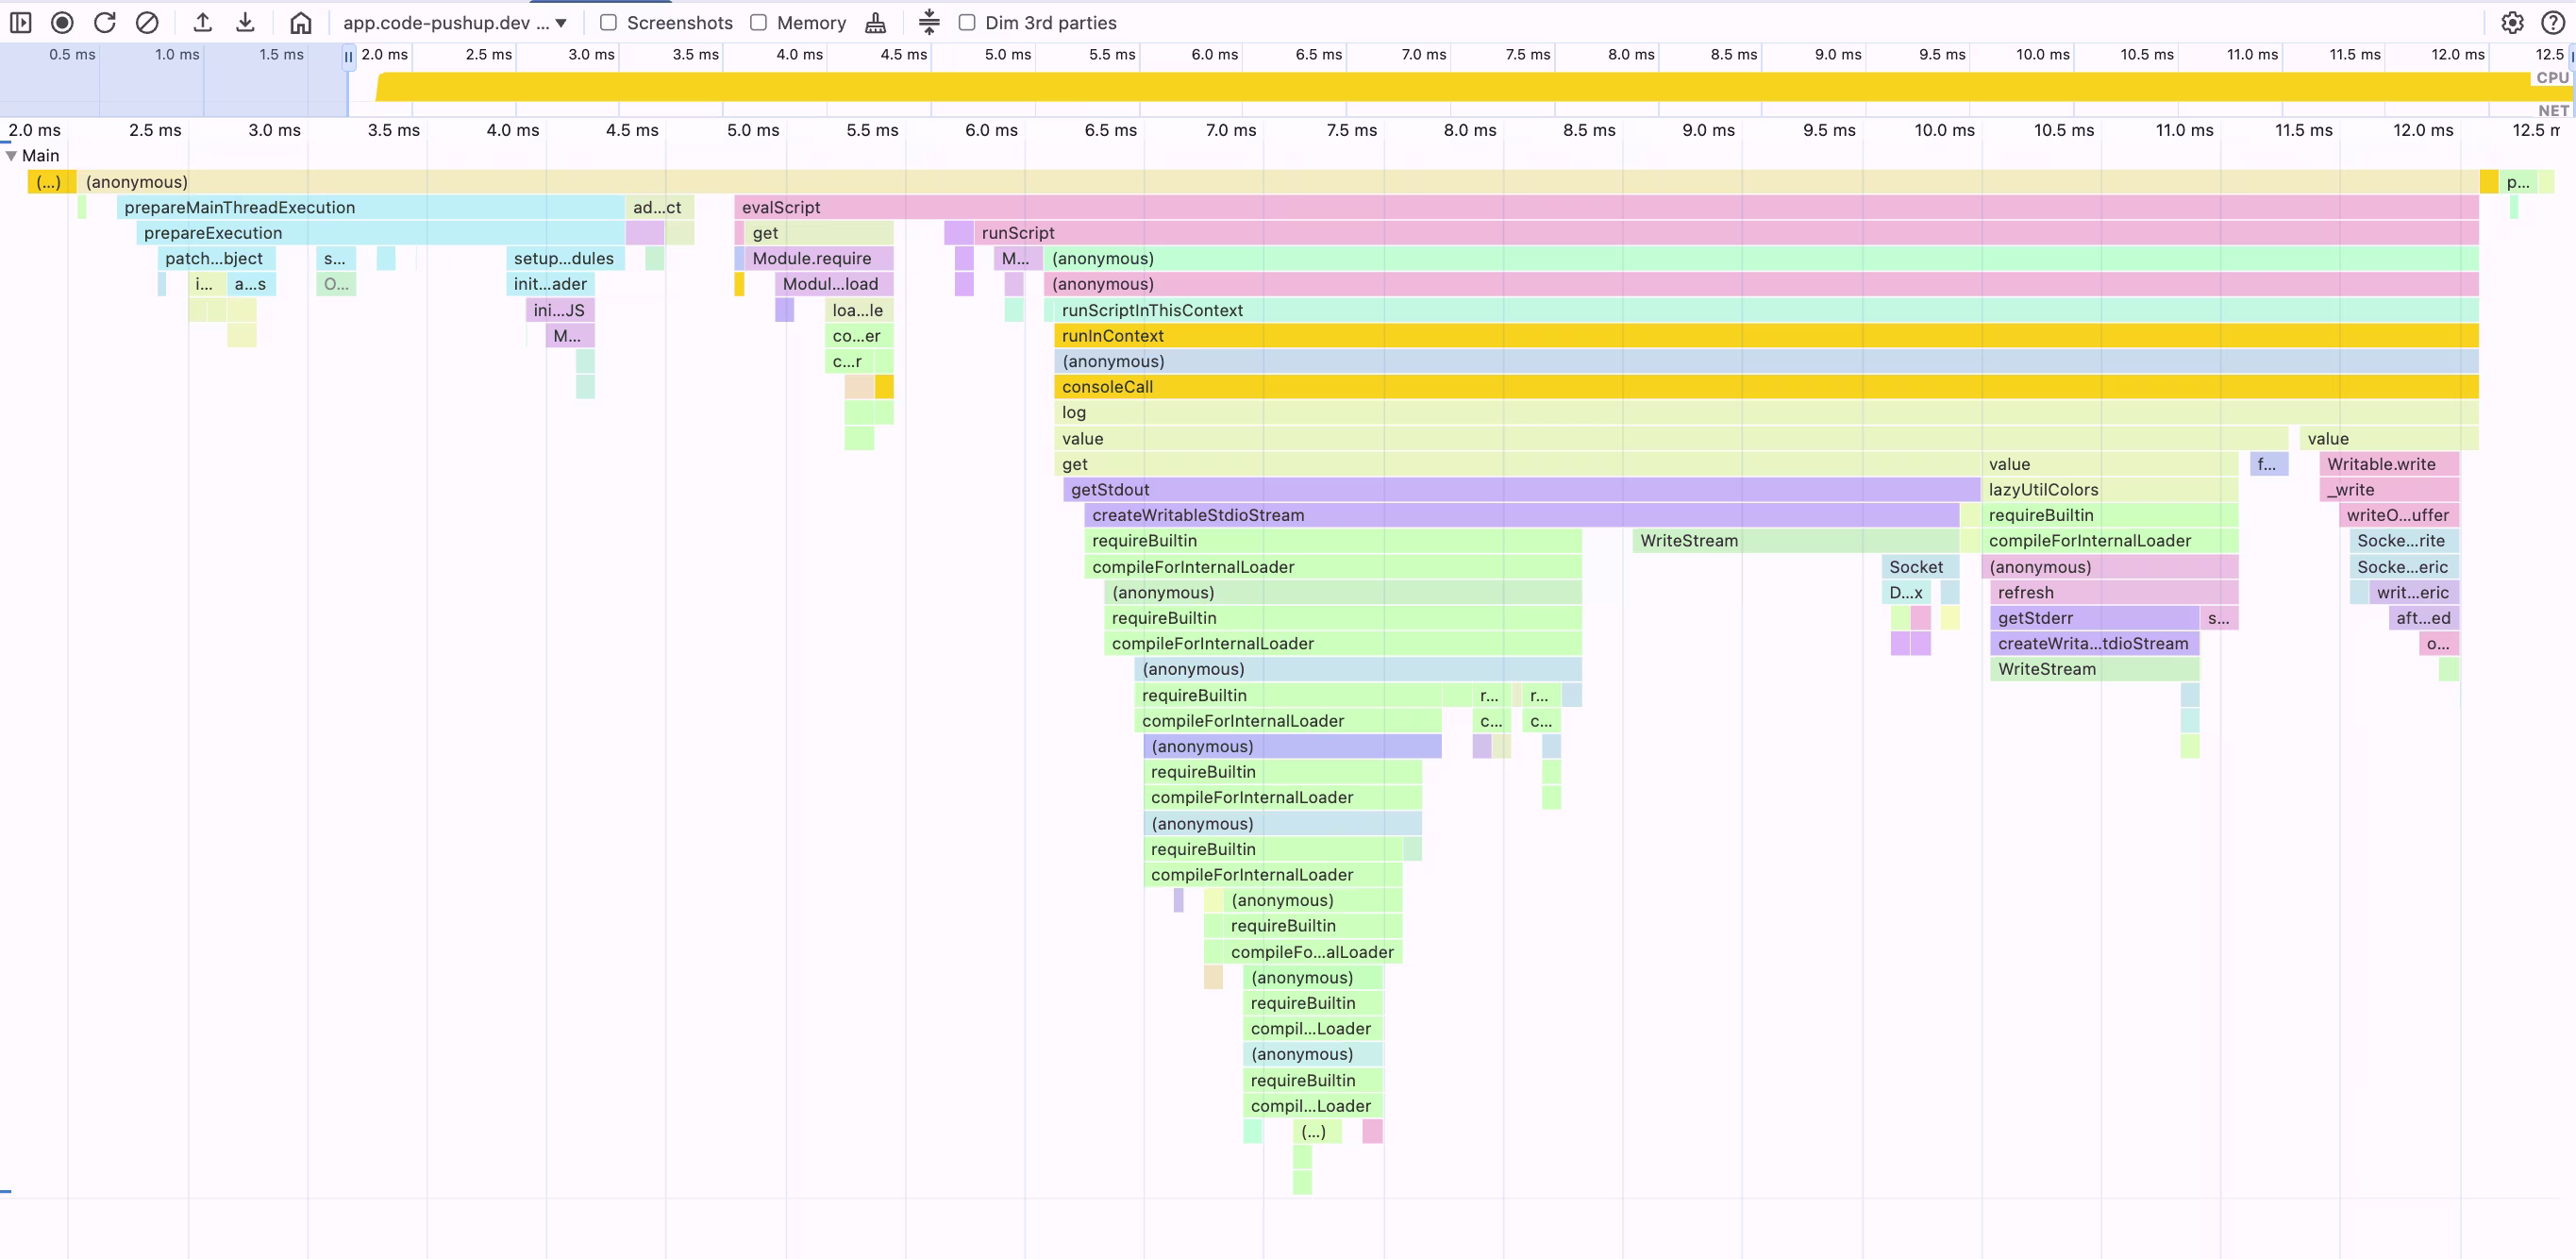
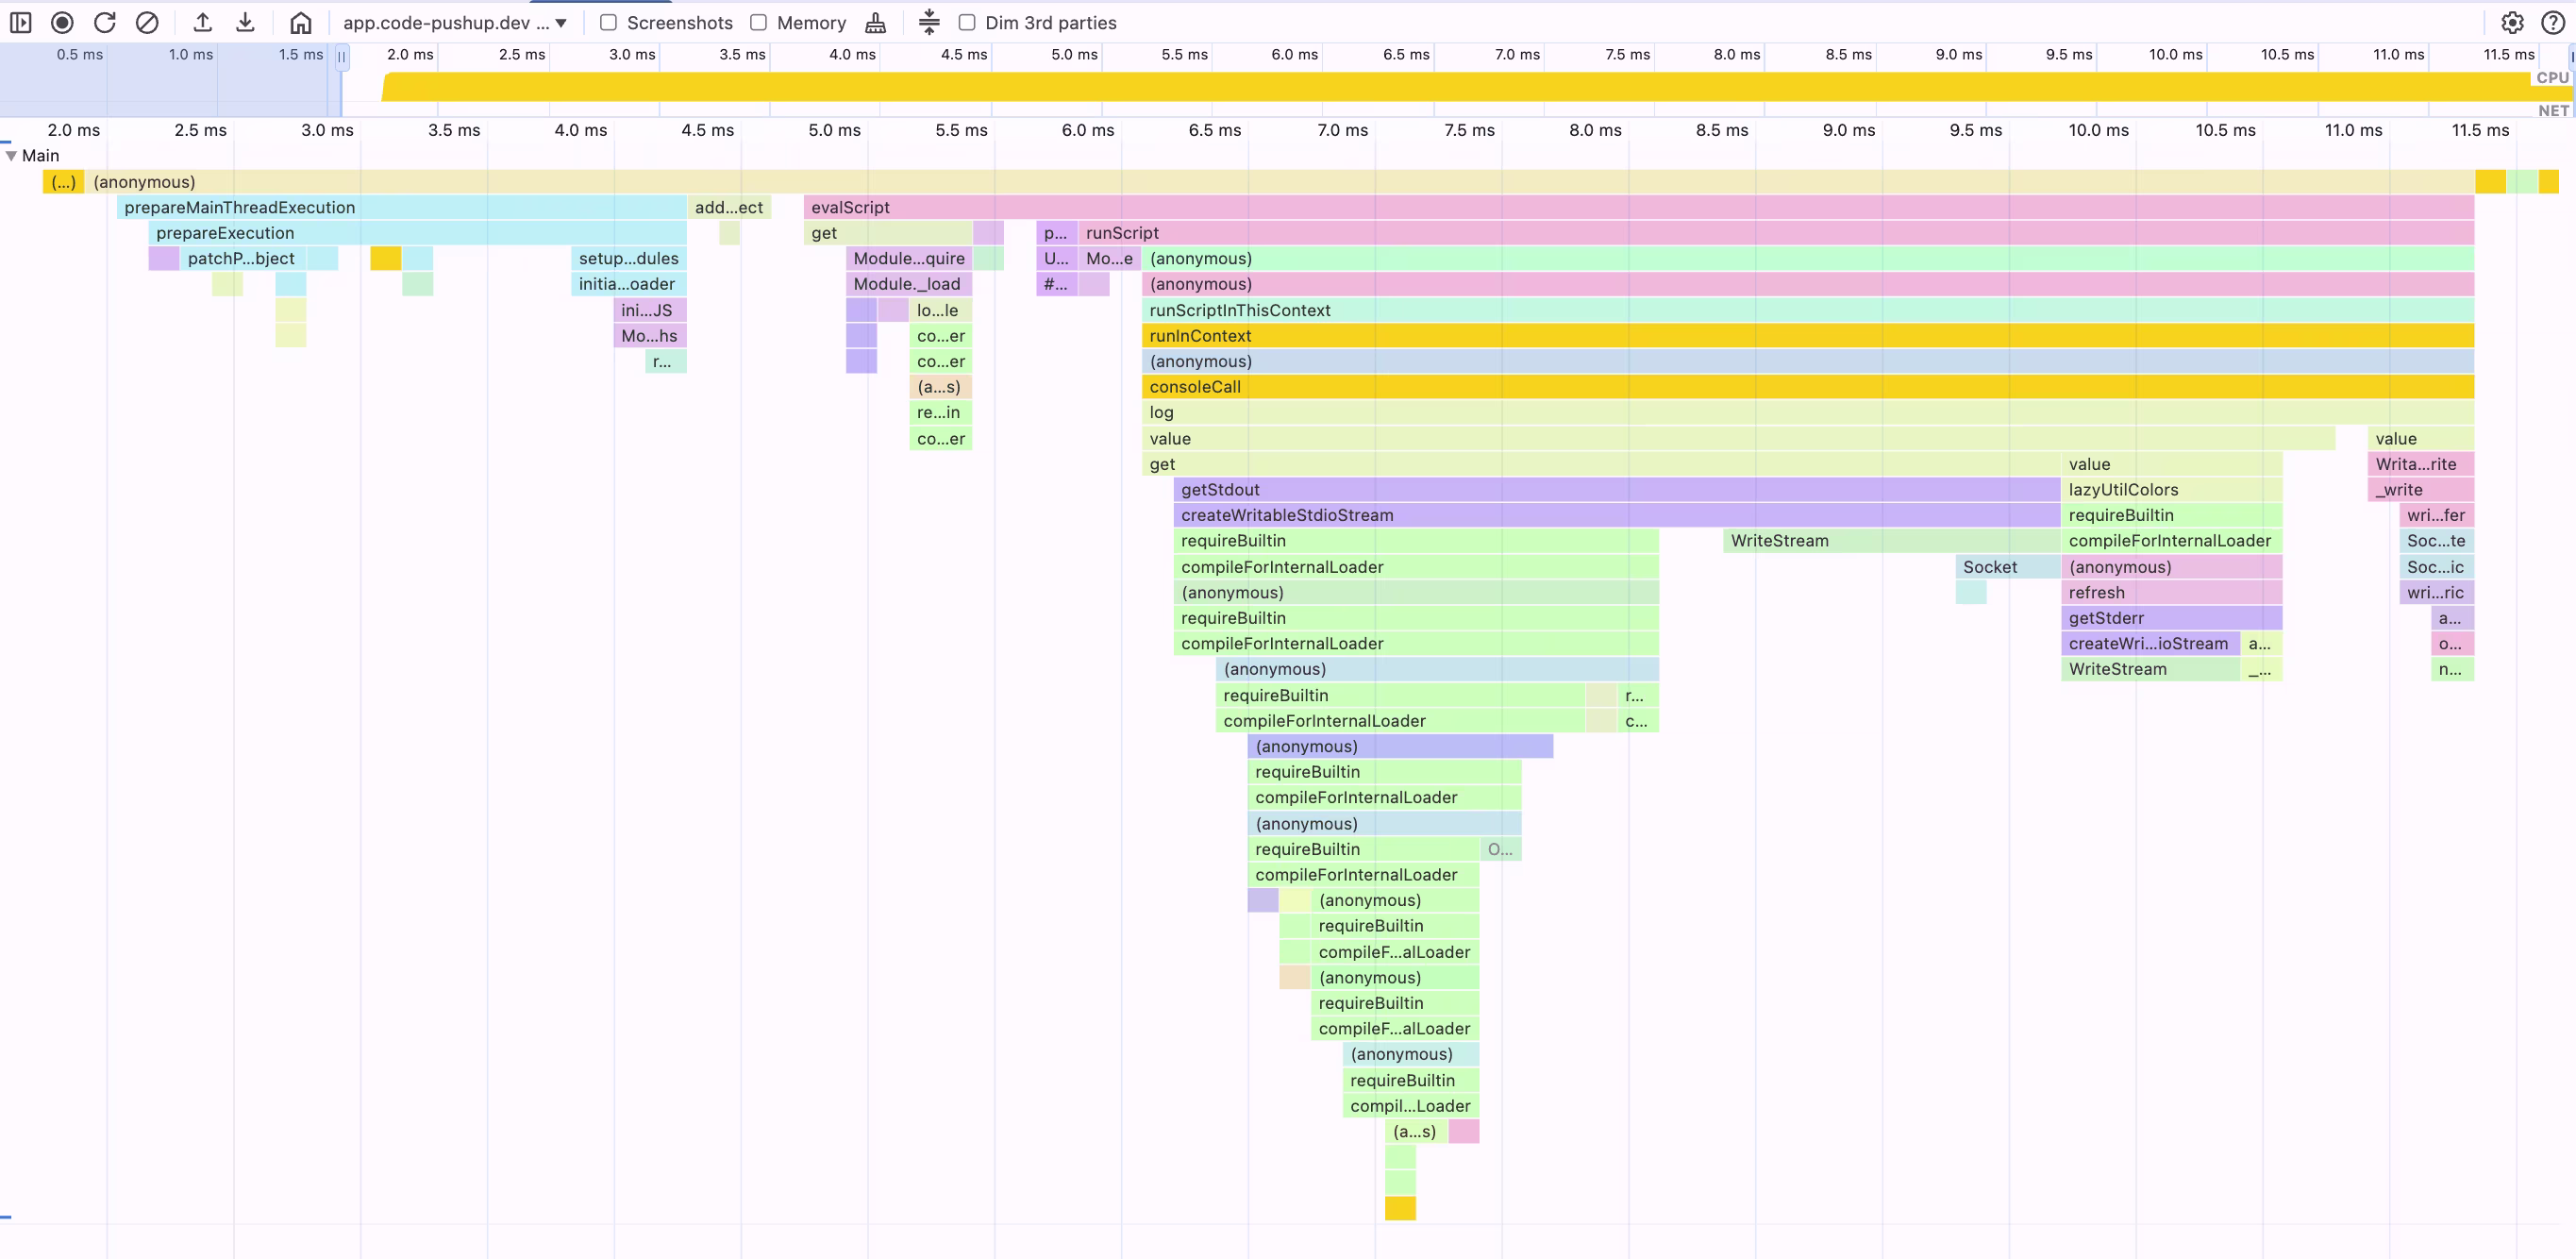
The table below shows how the sampling interval affects profile characteristics:
Profile File | Sampling Interval | Duration (Script) | Total Nodes | Total Samples | File Size | Visual Example |
|---|---|---|---|---|---|---|
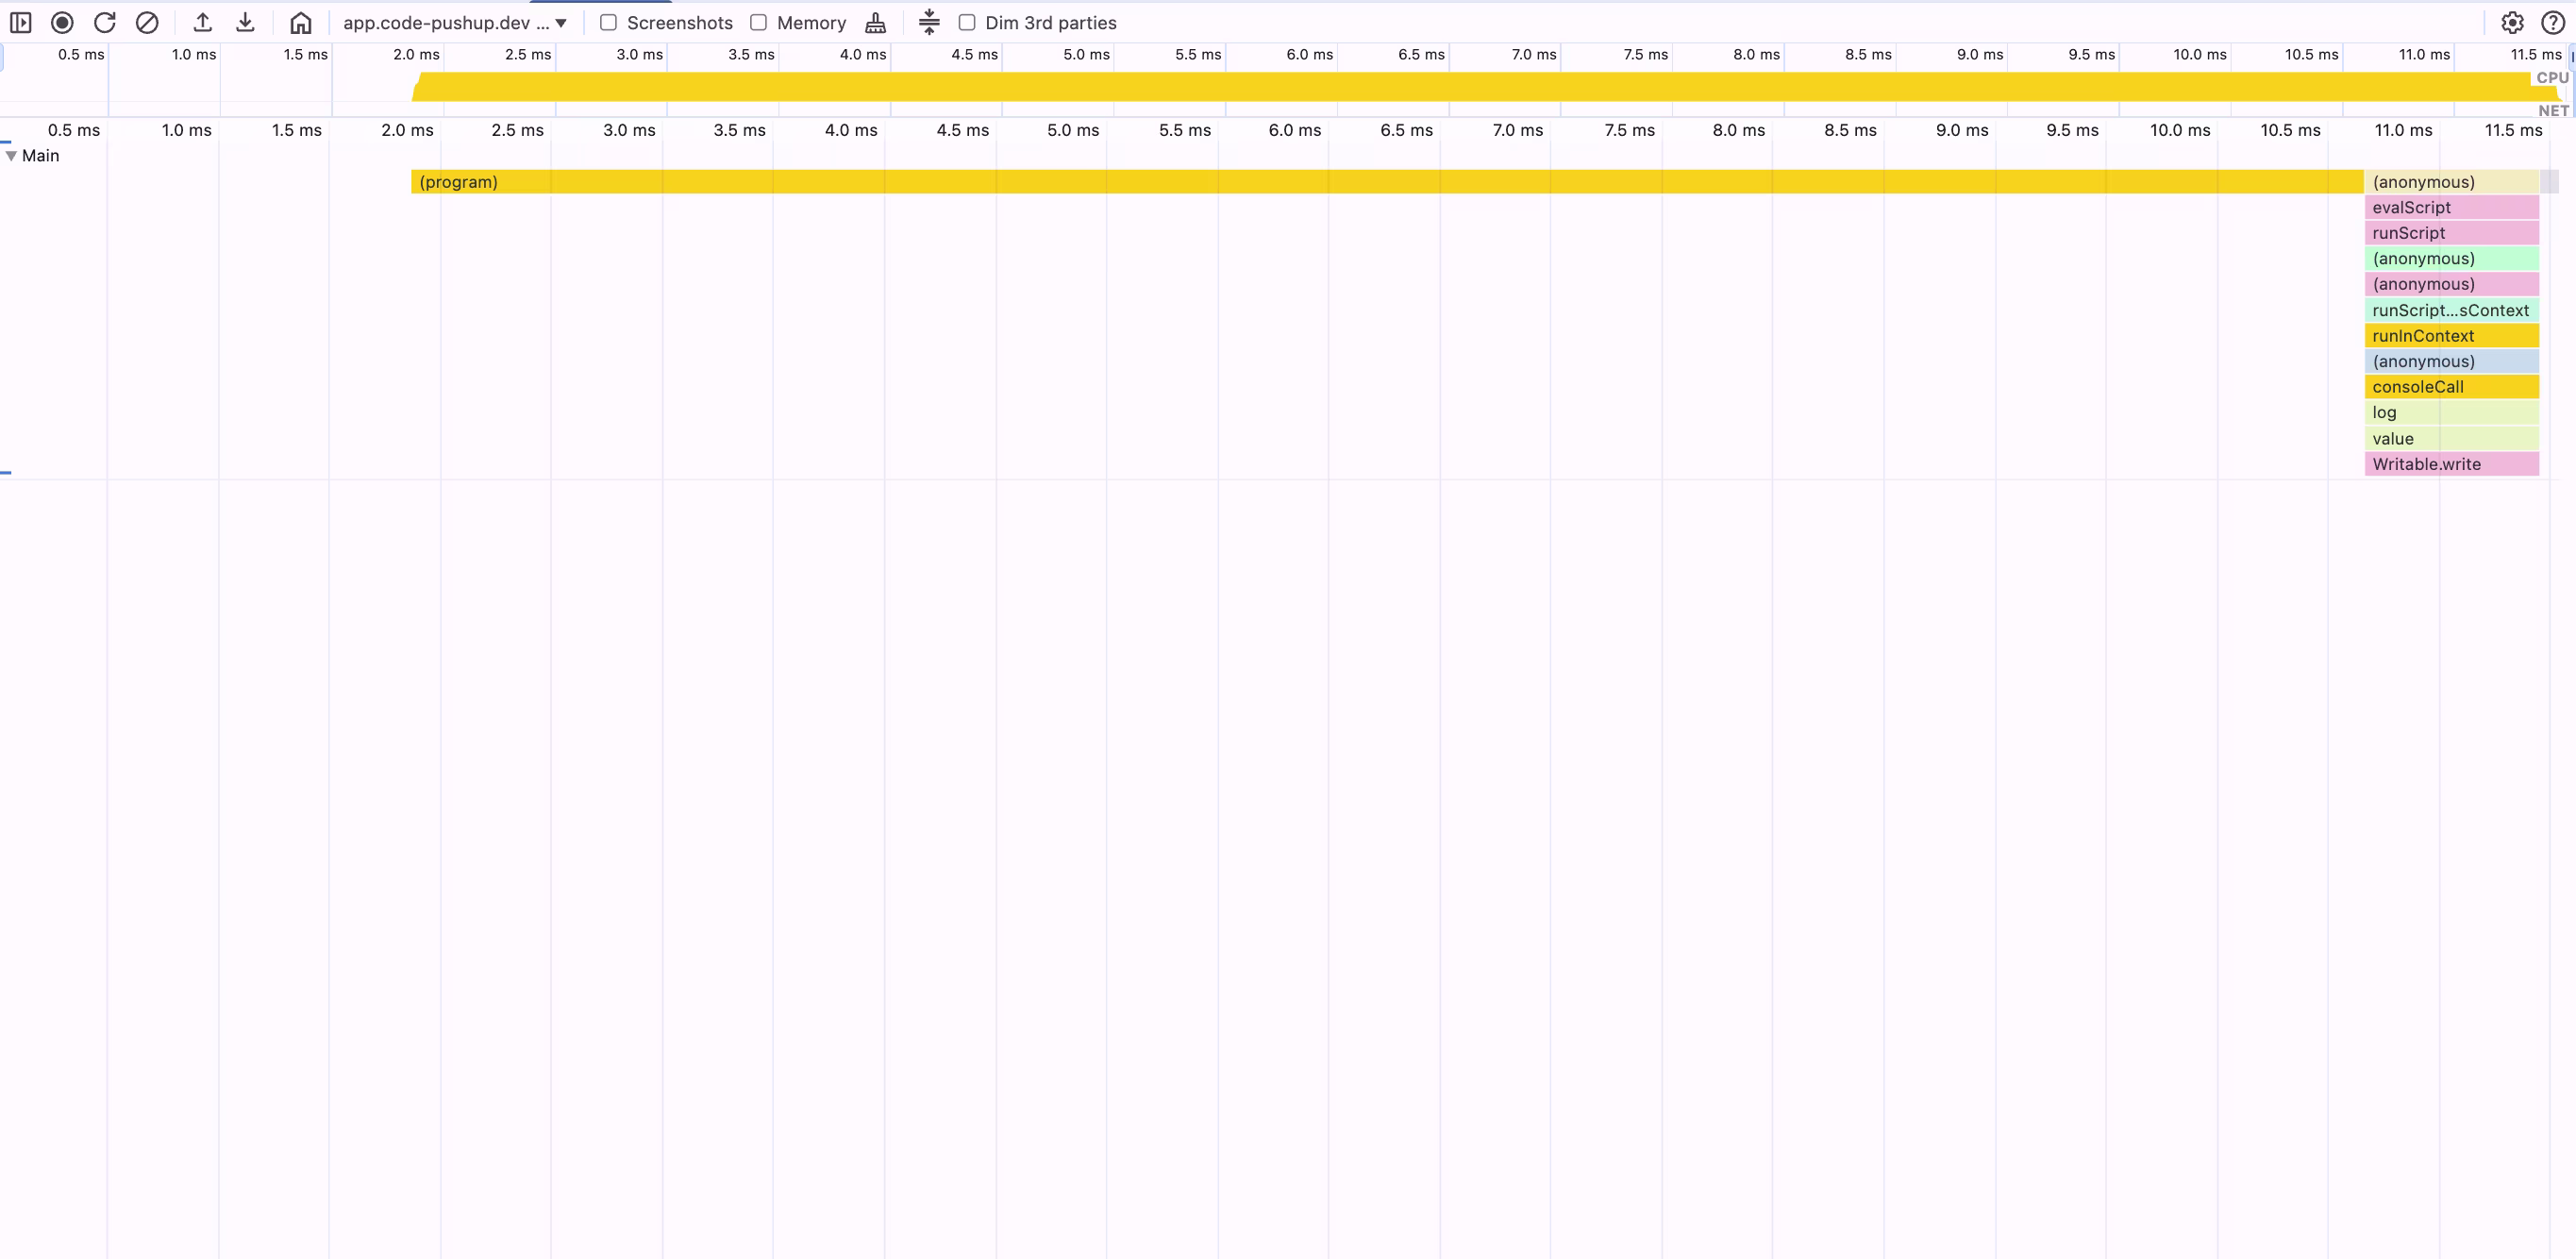
| 1 µs | 58.5 ms | 472 | 10,514 | 162.0 KB |
|
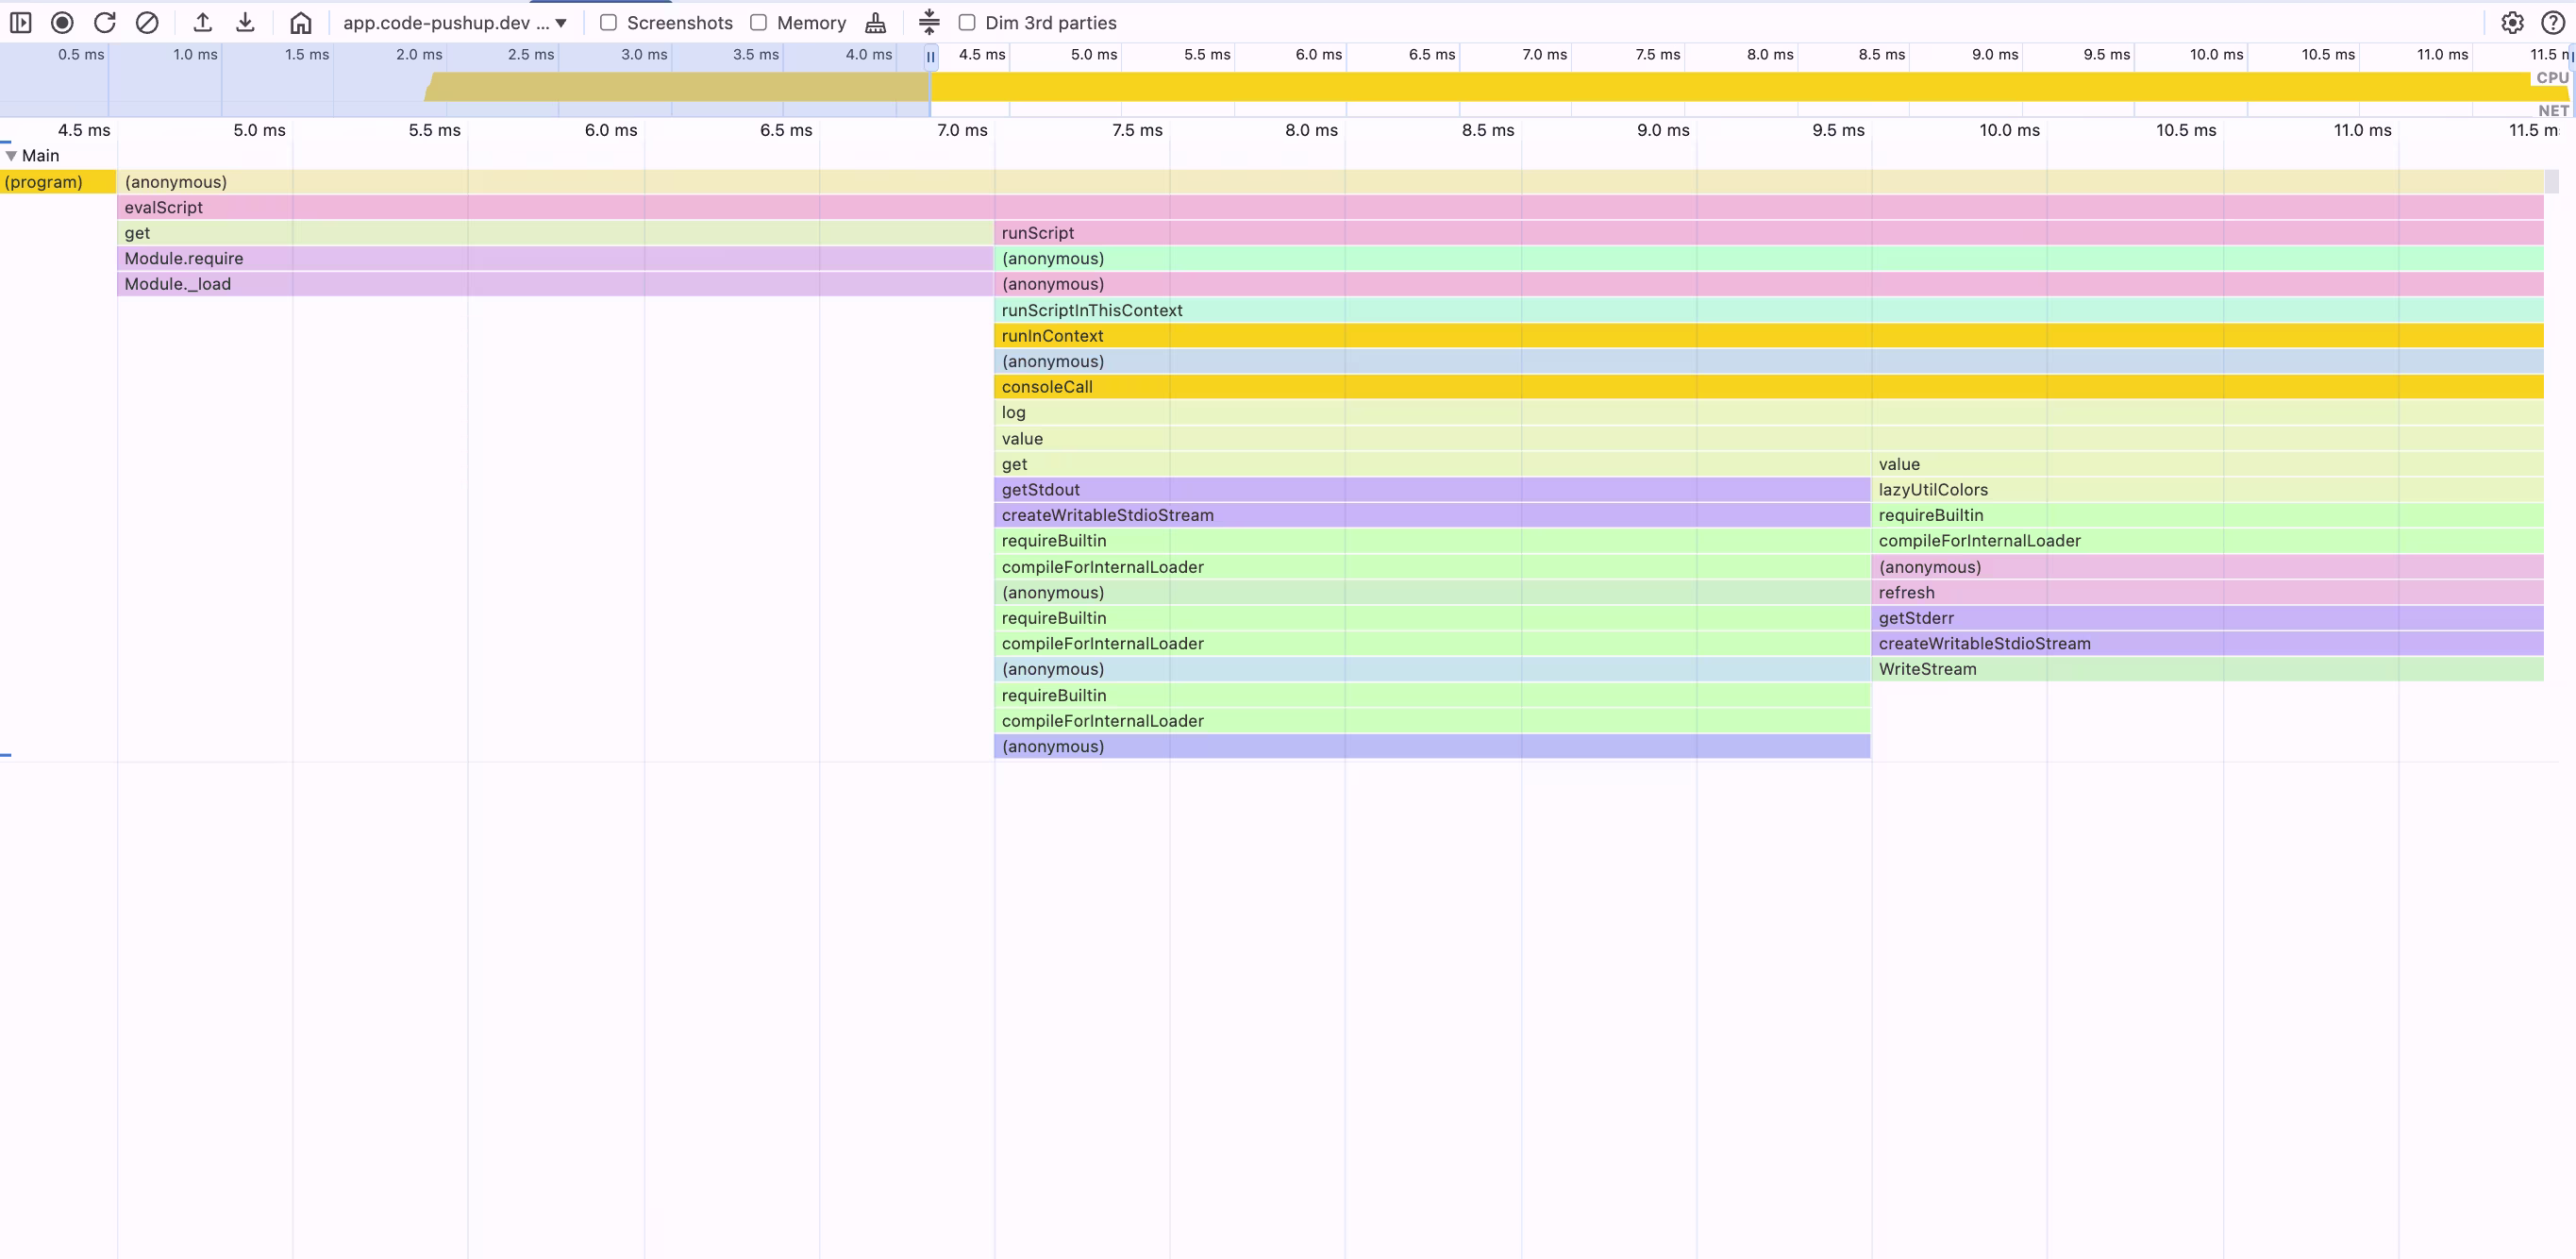
| 10 µs | 17.5 ms | 338 | 931 | 73.3 KB |
|
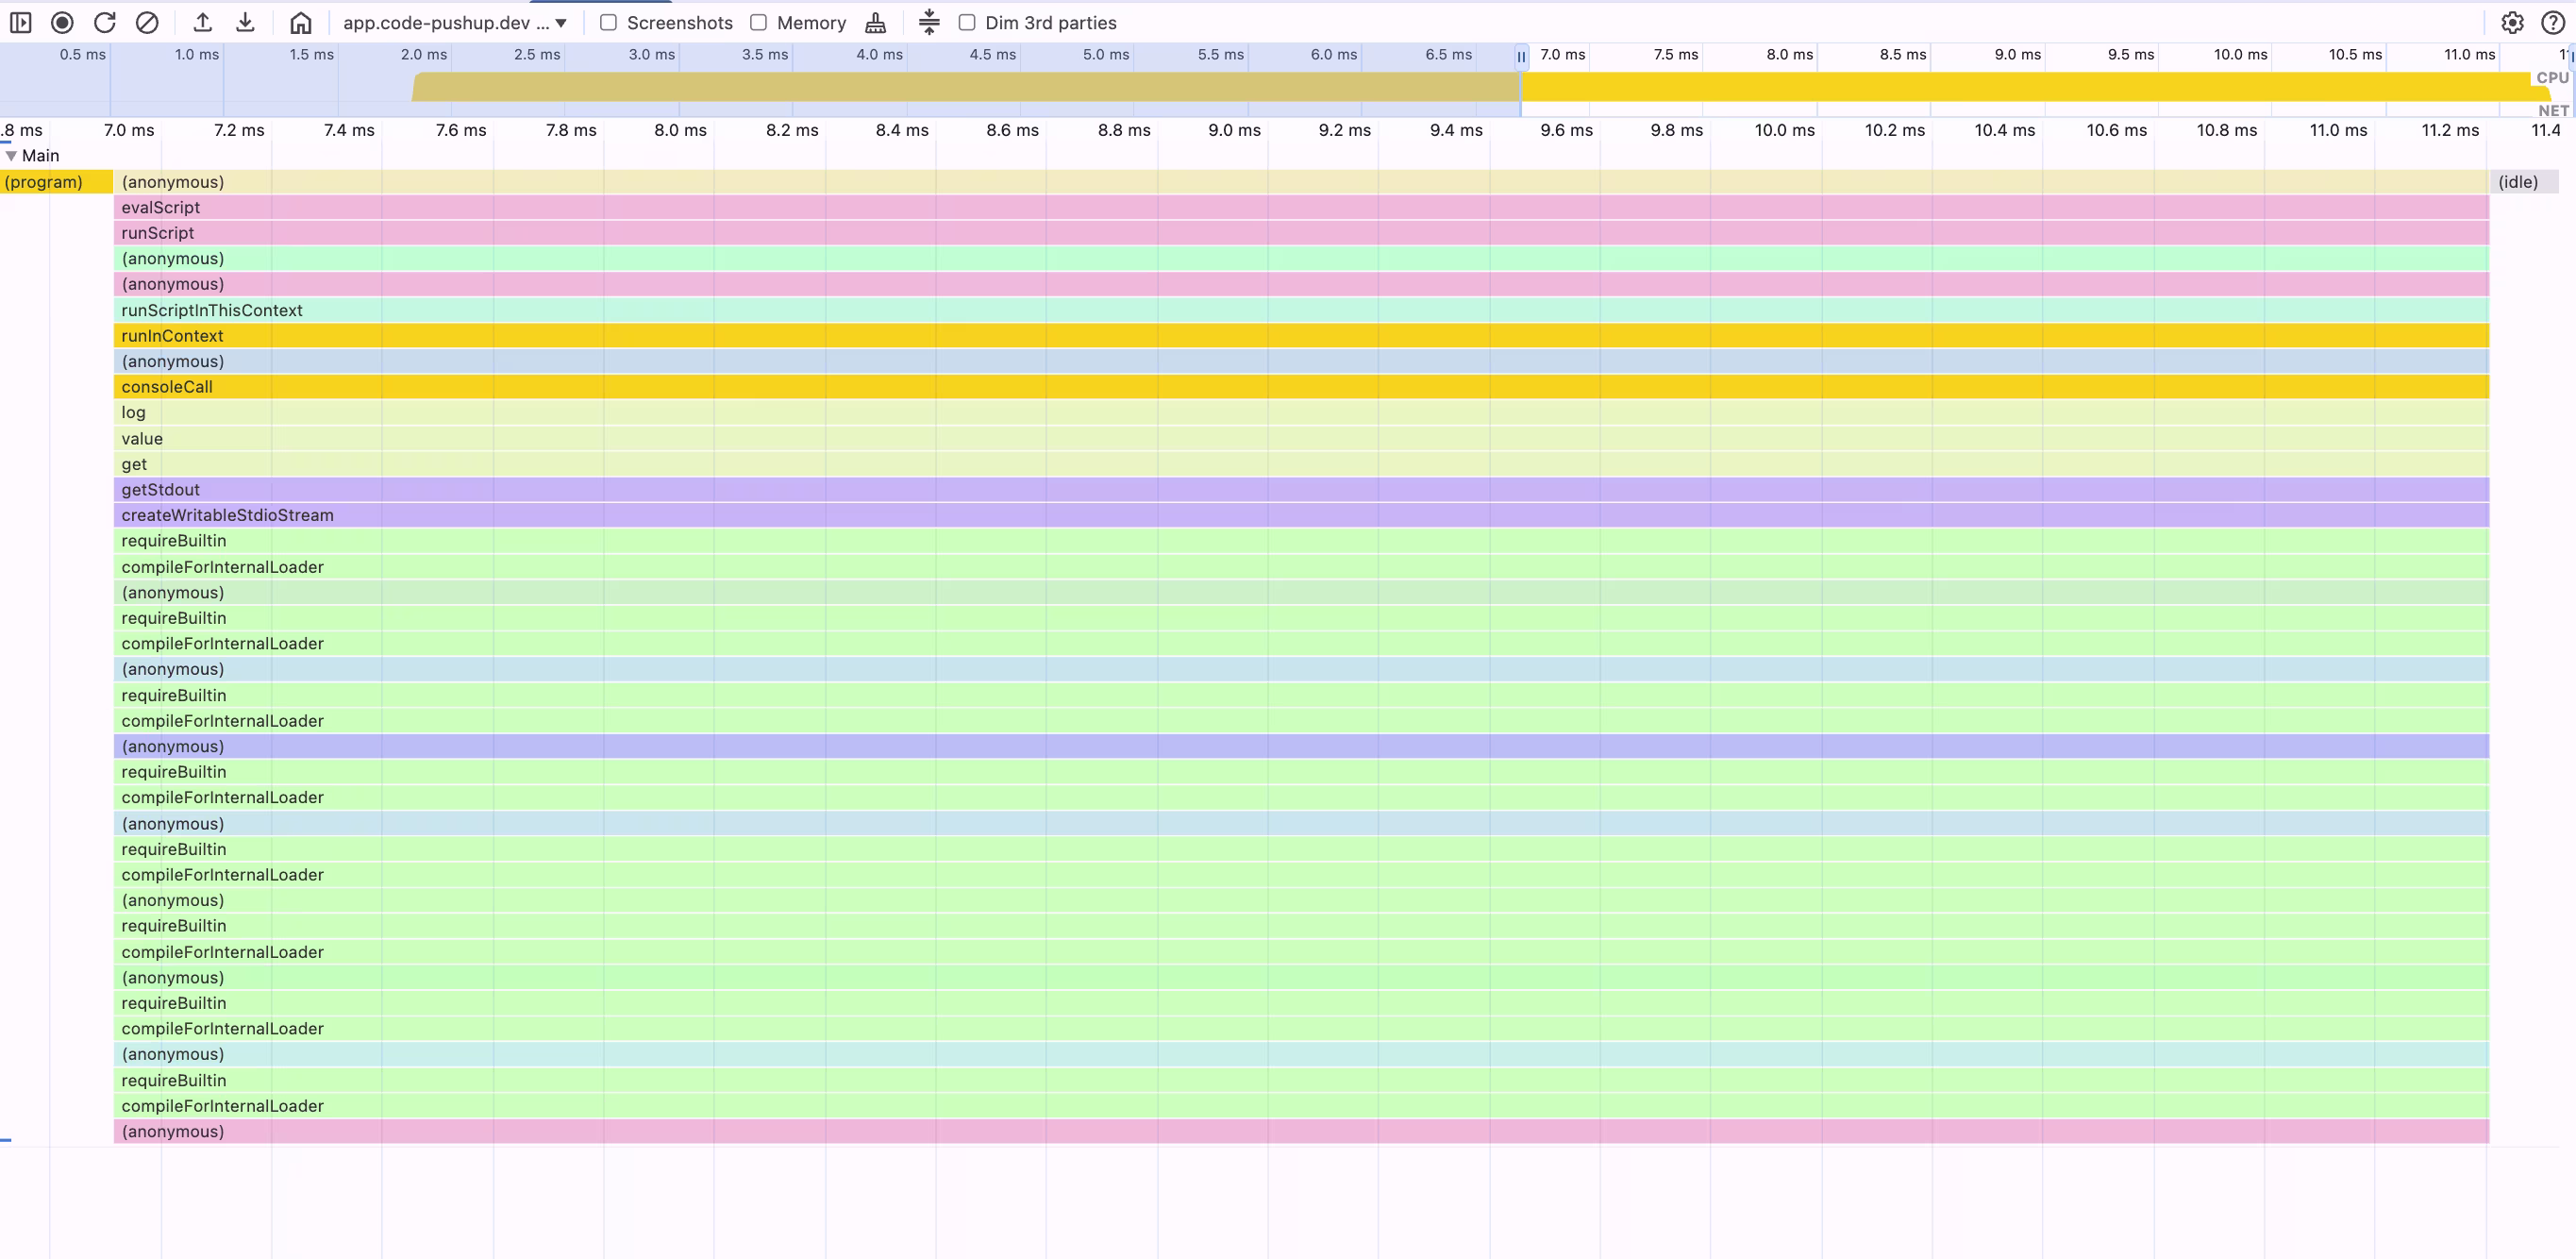
| 50 µs | 16.0 ms | 245 | 312 | 45.2 KB |
|
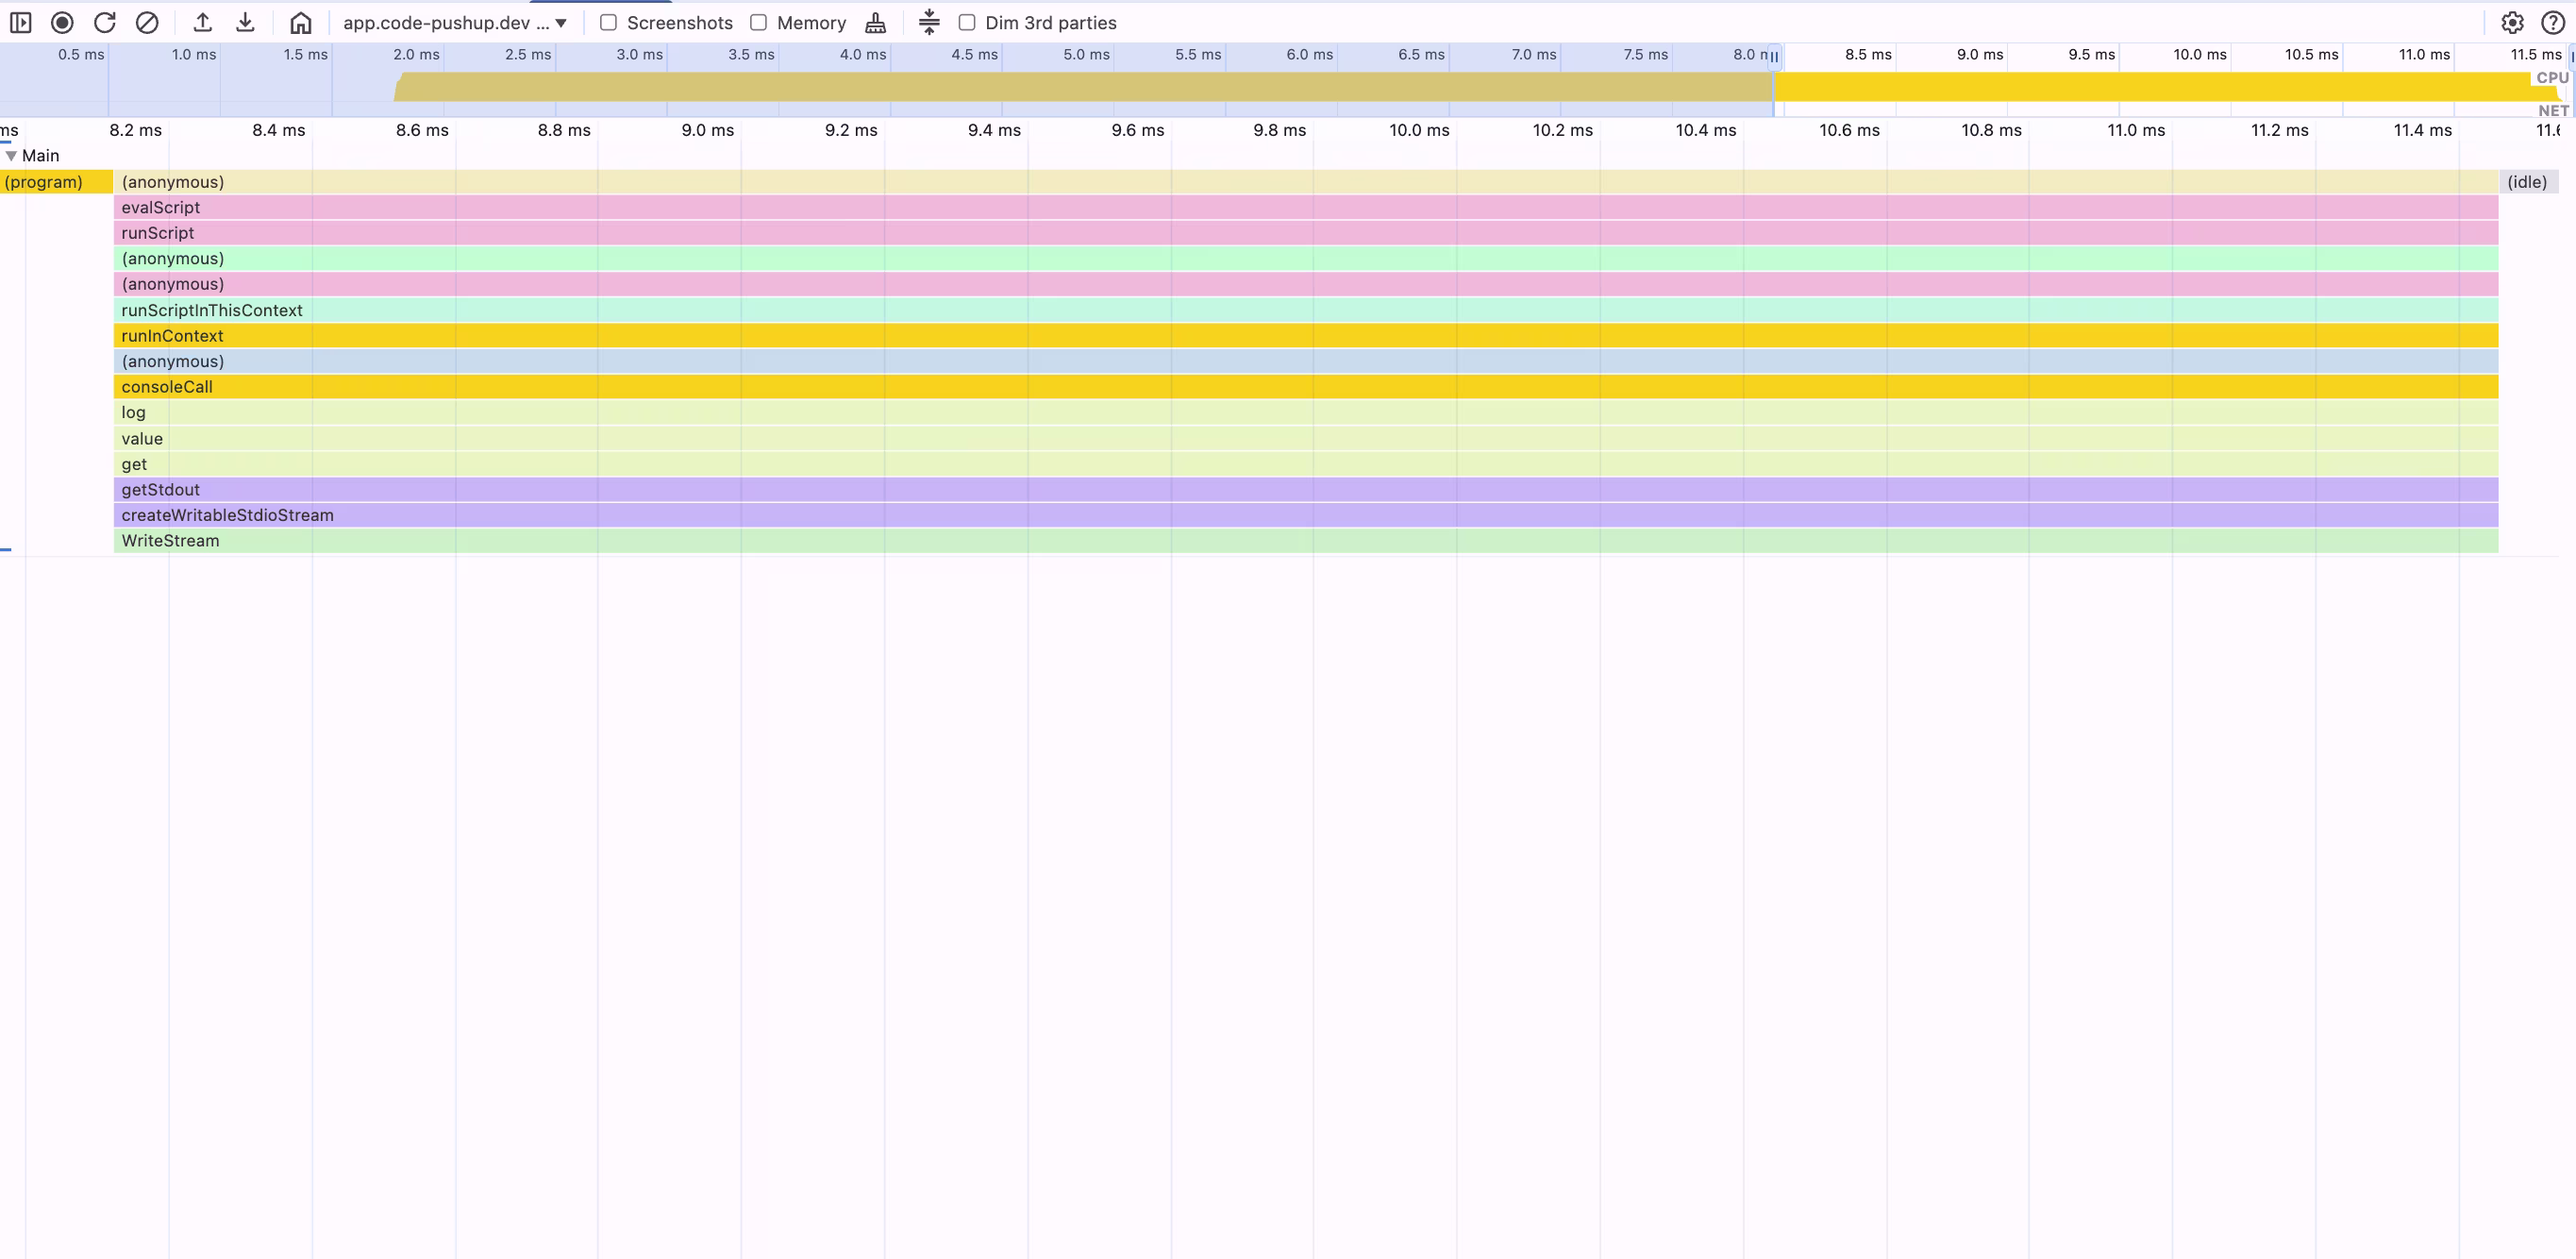
| 100 µs | 15.0 ms | 153 | 100 | 28.9 KB |
|
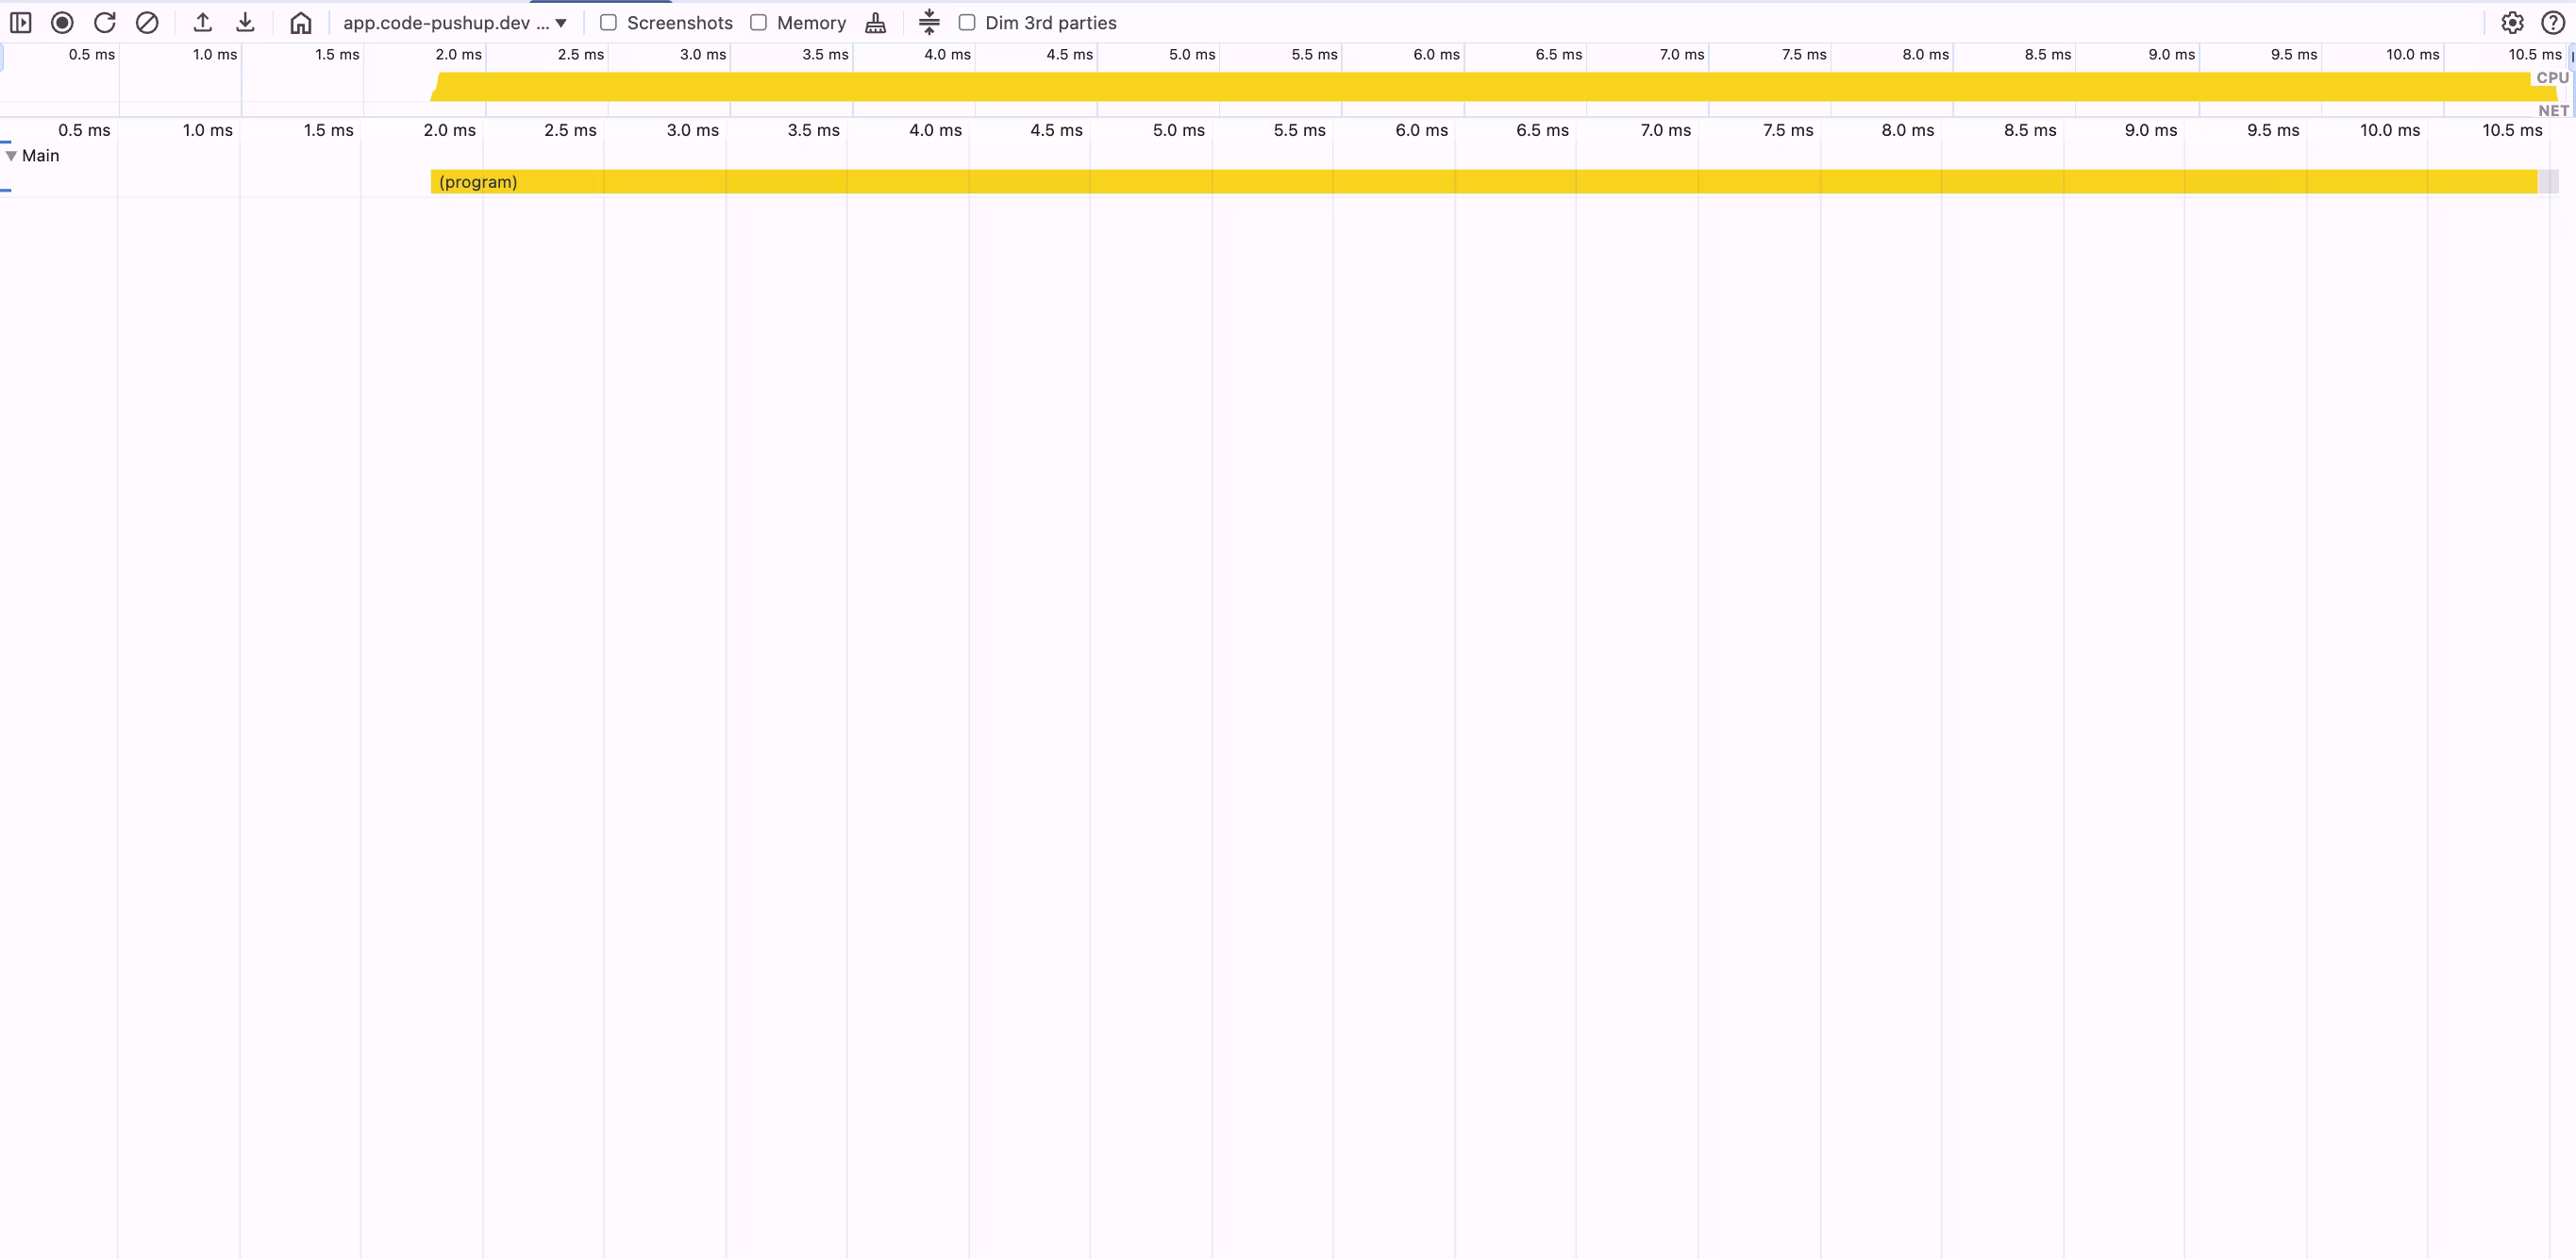
| 1000 µs (1 ms) | 13.9 ms | 49 | 10 | 8.6 KB |
|
| 2000 µs (2 ms) | 14.2 ms | 32 | 7 | 5.8 KB |
|
| 4000 µs (4 ms) | 13.5 ms | 18 | 4 | 3.2 KB |
|
| 5000 µs (5 ms) | 14.8 ms | 15 | 3 | 2.7 KB |
|
| 7000 µs (7 ms) | 13.2 ms | 9 | 2 | 1.8 KB |
|
| 10000 µs (10 ms) | 14.0 ms | 3 | 2 | 0.5 KB |
|
Organized profiling for A/B testing or feature comparison experiments.
# Compare different implementations
node --cpu-prof --cpu-prof-name="version-a.cpuprofile" version-a.js
node --cpu-prof --cpu-prof-name="version-b.cpuprofile" version-b.js
Low-overhead profiling with reduced sampling frequency.
node --cpu-prof --cpu-prof-interval=500 main.js
High-detail profiling with frequent sampling for bottleneck analysis.
node --cpu-prof --cpu-prof-interval=20 --cpu-prof-dir=./microbench-graph-creation util.js
Automated profiling in build pipelines using NODE_OPTIONS
This works for spawning both child processes and worker threads.
All profiles end up in the same directory due to the absolute path.
The sampling interval is very high to enable long-running processes to be profiled.
NODE_OPTIONS="--cpu-prof --cpu-prof-interval=5000
--cpu-prof-dir=/Users/username/reponame/profiles" node -e main.js
# .env
NODE_OPTIONS="--cpu-prof --cpu-prof-dir=/Users/username/reponame/profiles
node --env-file .env main.js
Advanced CPU profiling is essential for keeping Node.js applications running smoothly as they grow. By applying these techniques, you can find and fix performance issues before they escalate into larger problems that affect users. As you gain experience with these tools, you will find that even the most complex optimization challenges become more approachable.
Advanced workshop
High-Speed Angular applications on any device
Learn more
Part 2 is a practical walkthrough to diagnose and speed up LCP. Learn to read CrUX trends, profile in Chrome DevTools, preload critical assets, use srcset, defer third-party scripts, and code-split Angular bundles to turn red LCP into green.


Profiling is easiest when it's real. Learn how to capture and make sense of CPU profiles in Node.js across scripts, threads, and processes—then apply it to your own projects.

Largest Contentful Paint (LCP) is a Core Web Vital that shapes user perception of speed. This first part explains what LCP is why it matters for SEO and business, and how its phases affect site performance.

CPU profiles are more than flame charts—they’re structured JSON files. Learn how nodes, samples, and time deltas form the backbone of DevTools performance data.

Angular is bridging the gap between the new Signal-Forms architecture and the Template/Reactive Forms. This isn't just a minor update—it’s a fundamental shift in how we author custom form controls.


A small performance audit including thought processes and methodology