
Advanced workshop
Architecting Angular Apps for High Performance
High-Speed Angular applications on any device
Learn more
In part 1 of this series, I’ve covered LCP as a metric in general. We’ve discussed its specification, explored generic optimization opportunities, and elaborated on the current state of LCP experienced throughout the web.
Part 2 takes a more practical approach where you’ll gain useful insights into how to measure and optimize your own application, applying & extending the knowledge from part 1. We’ll start by covering how LCP can be measured with the help of the CrUX Dashboard.
Based on a lab application, we will manually profile LCP using the Chrome Dev Tools and strategically applying optimizations for each of the phases.
LCP, is a key metric for understanding user experience. It's crucial to measure LCP using tools like CrUXVis and Chrome Dev Tools to identify the current state, bottlenecks and optimization potential. Optimizing LCP involves addressing four main phases:
Time to First Byte: Improve server response times with caching and CDNs.
Resource Load Delay: Preload critical LCP resources, reduce JS/CSS sizes, and consider SSR.
Resource Load Duration: Optimize assets like images and videos, using srcset for responsiveness.
Element Render Delay: Implement code splitting, defer non-critical third-party scripts, and fetch LCP-related data early.
By systematically applying these optimizations, you can significantly improve your LCP score and provide a faster web experience for your users.
It’s always critical to understand if there is something to optimize before jumping into optimizations. So you’d want to know how your application stands in terms of LCP.
In case your website is indexable, you can easily use CrUXVis to figure out how your website is performing based on RUM data.
Simply enter your website into the URL input and proceed.
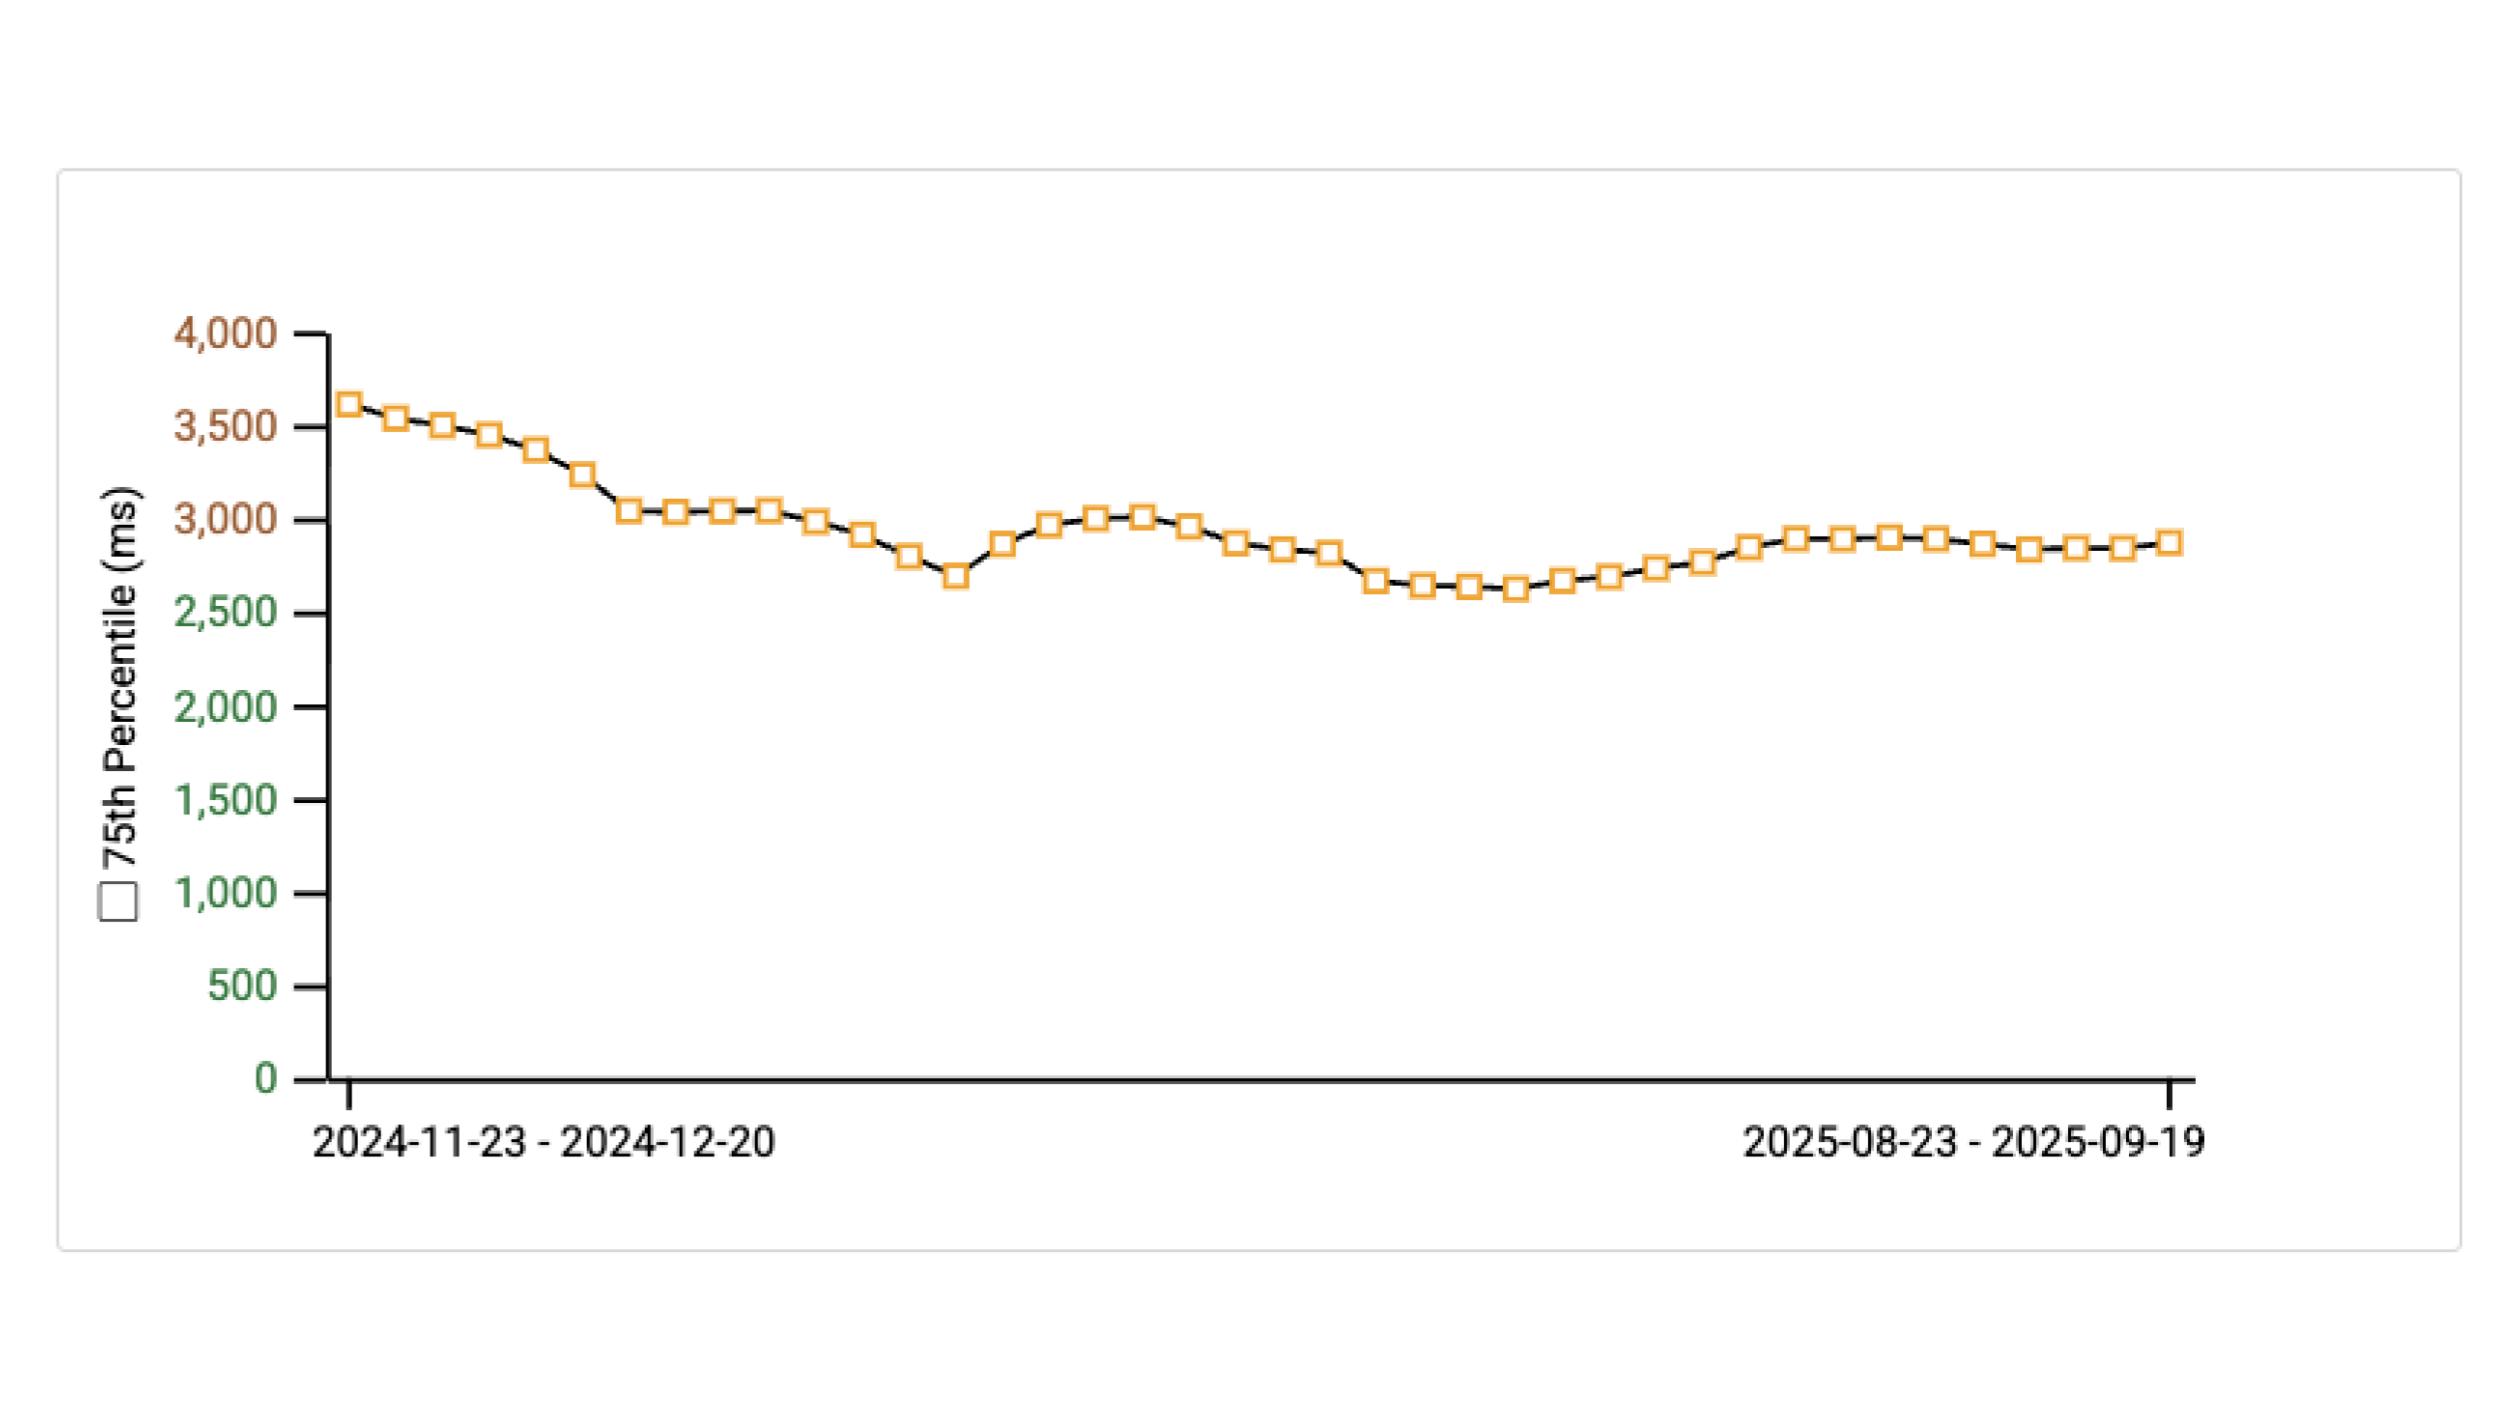
The Loading Performance report lets you observe the 75th percentile LCP values of your users over time with a configurable time span. This also gives you a nice overview of trends and lets you validate the improvements you have landed.
The following image shows how LCP is presented in the CrUX Vis Loading Performance report. The data is from https://web.dev.
Let me give you a quick overview of the lab application and testing conditions for all the measurements in this post:
Profiling was done under the following conditions:
Machine
MacBook Pro 14 M4 Max
Chrome Dev Tools
Network throttling: Slow 4G
CPU throttling: 4x
Device simulation: Samsung Galaxy S8
Only observing RUM data isn’t enough when you want to optimize LCP. You’ll need to go hands-on and figure out how your application produces the LCP element, which requires manual profiling of your application.
For manual measurements, I highly recommend using the Performance Tab in the Chrome Dev Tools.
The first thing you’ll notice is the Live metrics section. The live metrics already provide some details about Core Web Vitals measured during your active session.
Live metrics are useful to understand the current Core Web Vitals scores without having to create a performance recording first.
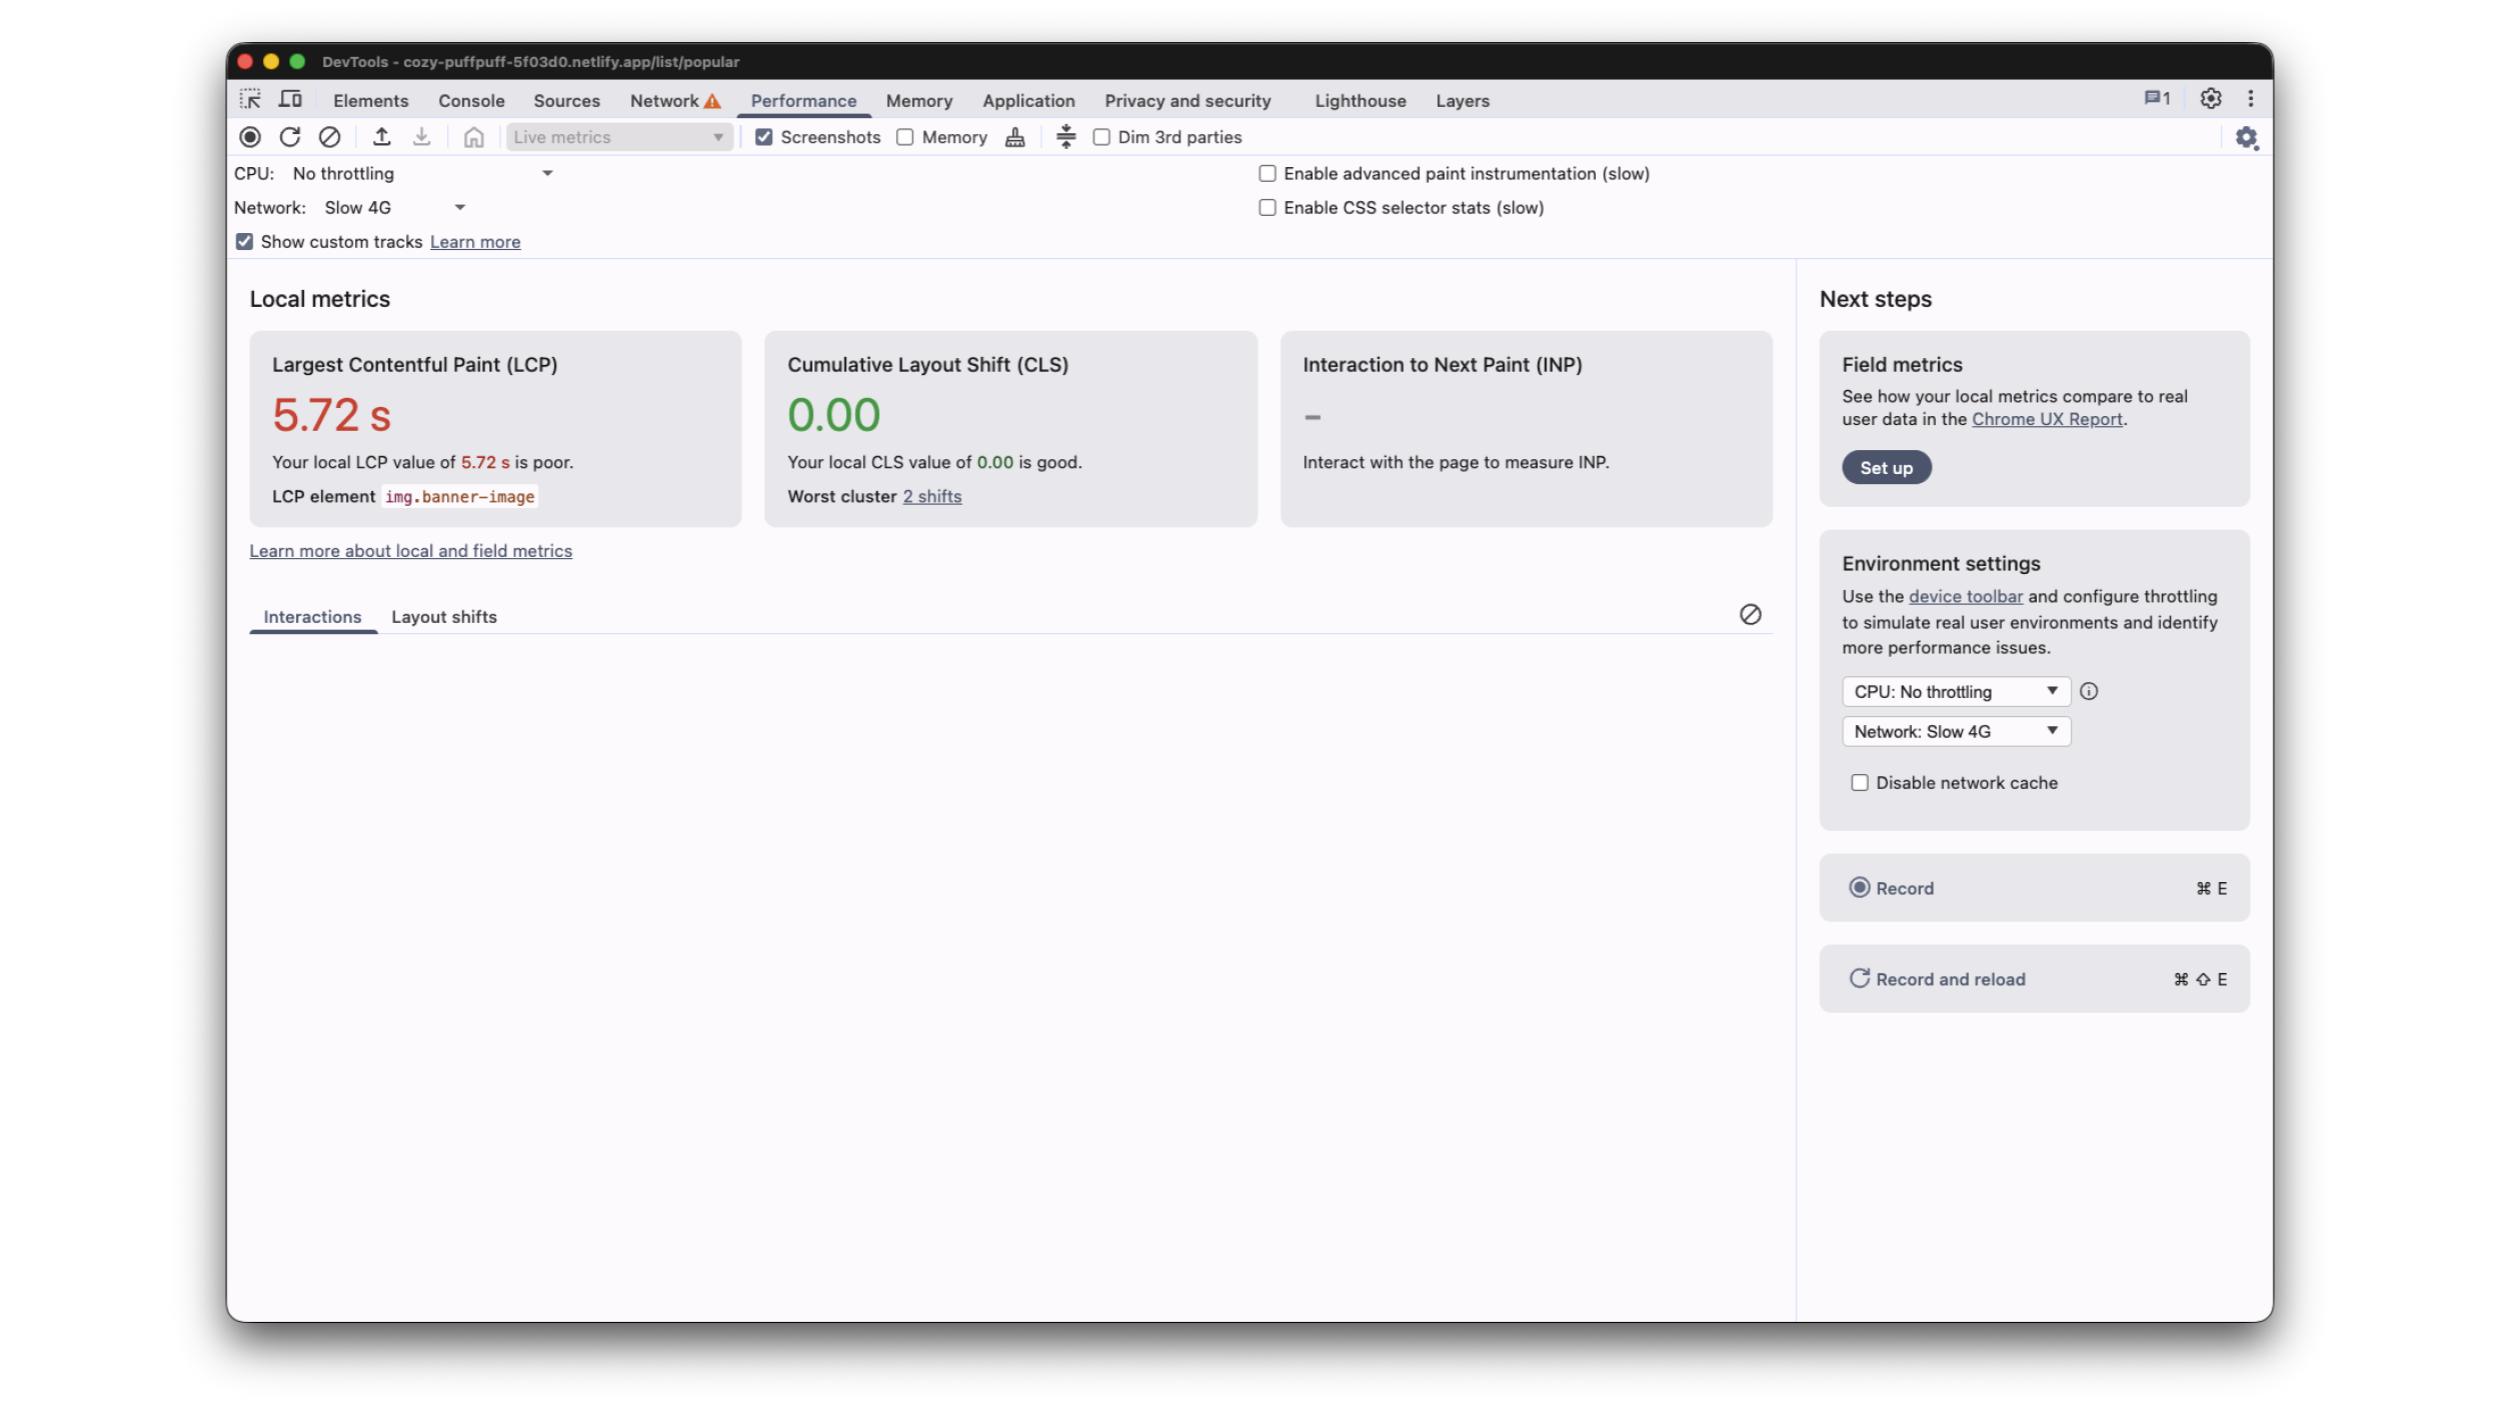
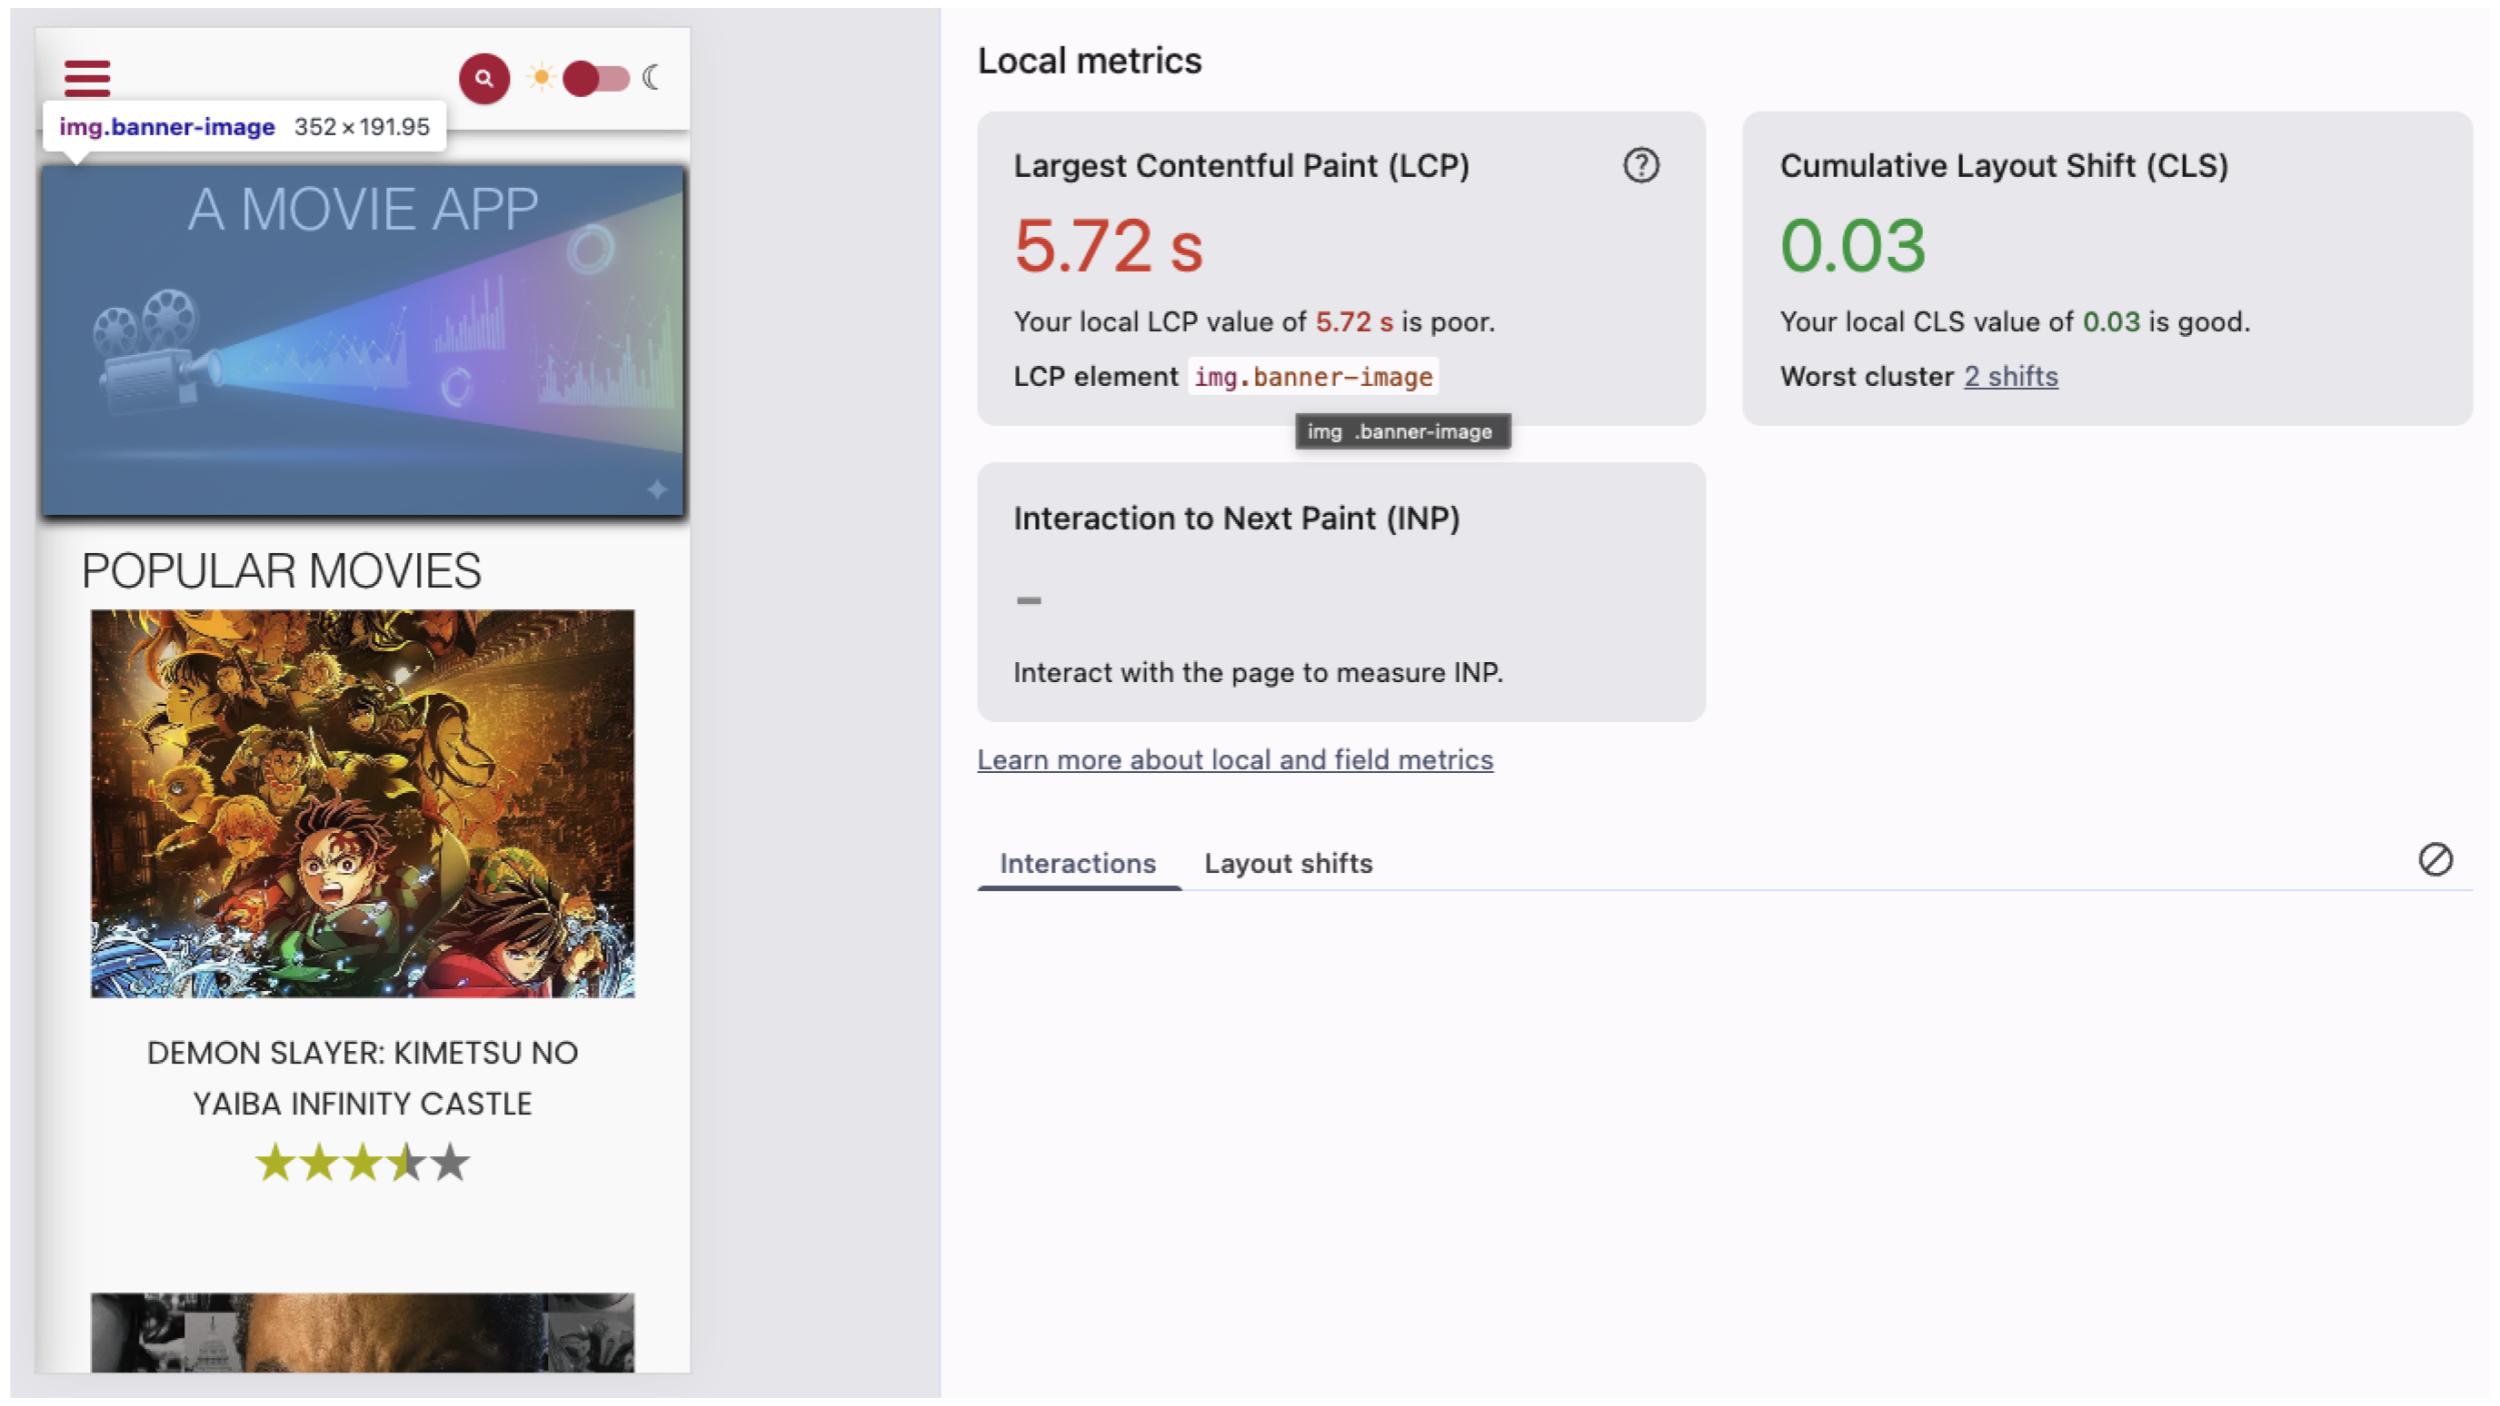
In the case of LCP, the live metrics also show the element that gets reported as LCP. In this example application, it’s img.banner-image
However, if you want to understand how your LCP is scored and find optimization opportunities, you should run a performance recording and analyze the profile.
The event we are looking for is the LCP event, which is displayed in the bottom row. Selecting it reveals detailed information about the LCP event in the Summary pane at the bottom of the screen.
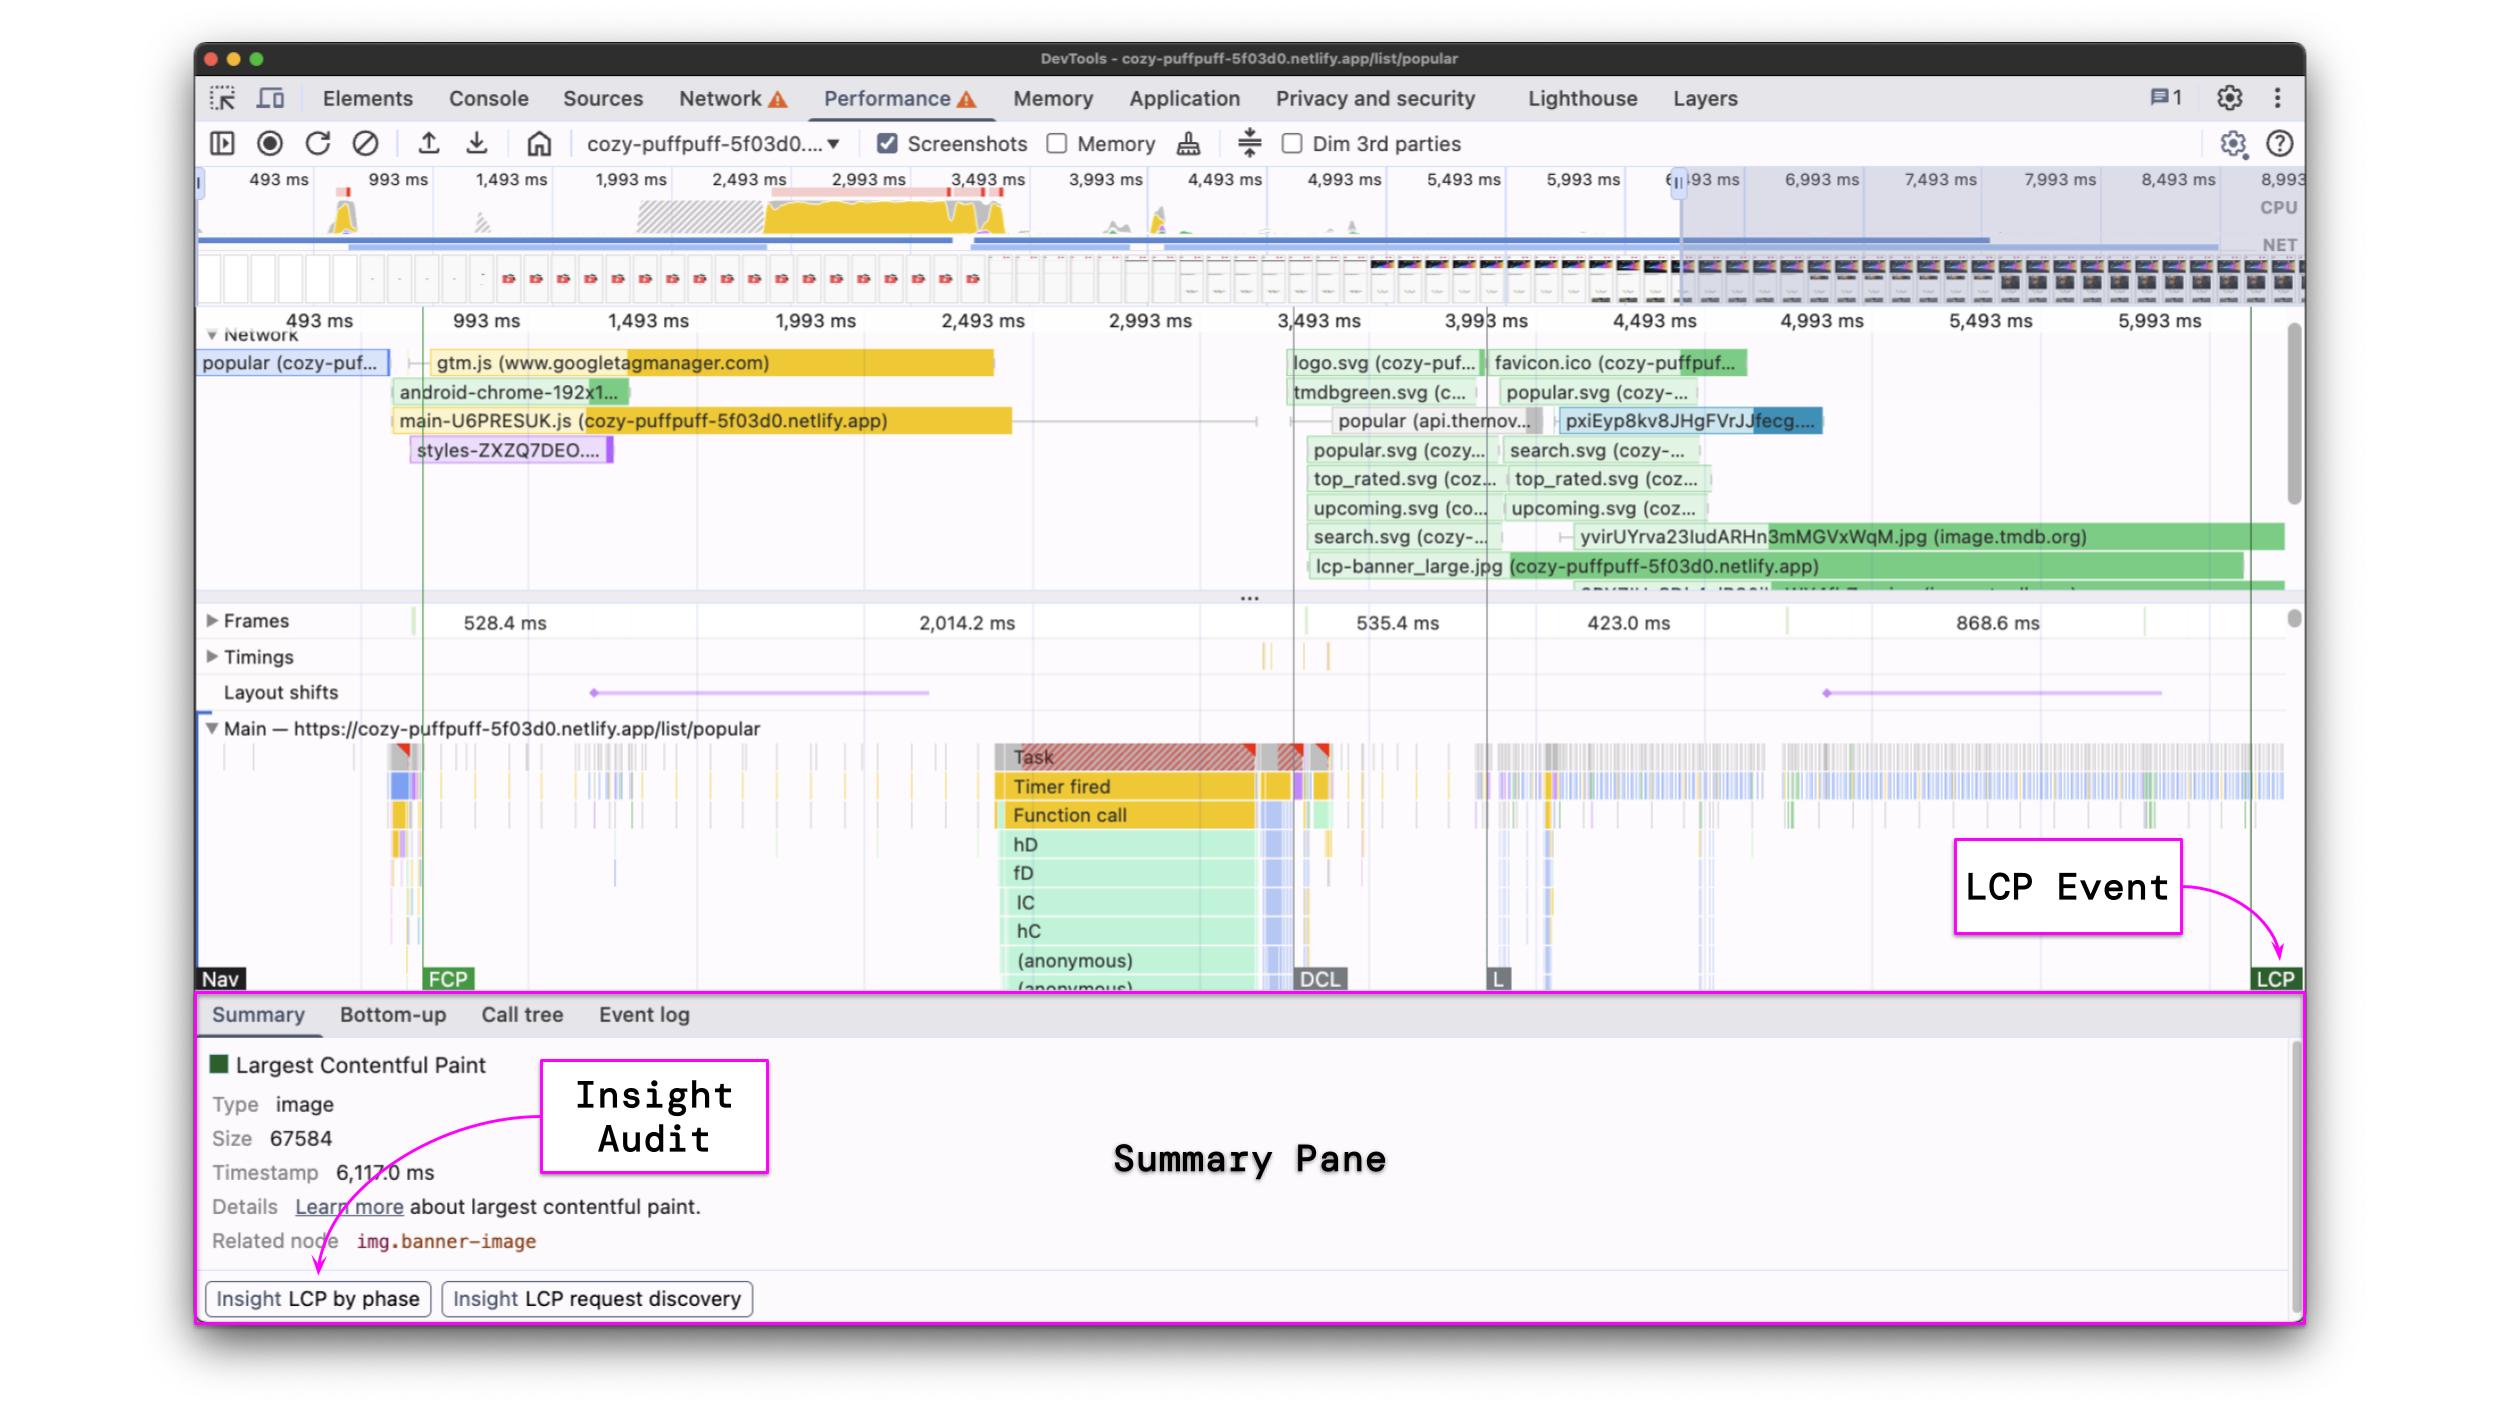
In addition to the LCP event details, the Summary pane also provides two links to insight audits. Following them opens the new insights panel.
The new insights panel is a helpful tool to identify LCP bottlenecks more easily.
The LCP by phase audit breaks down into the different phases of LCP:
Time to first byte
Resource load delay
Resource load duration
Element render delay
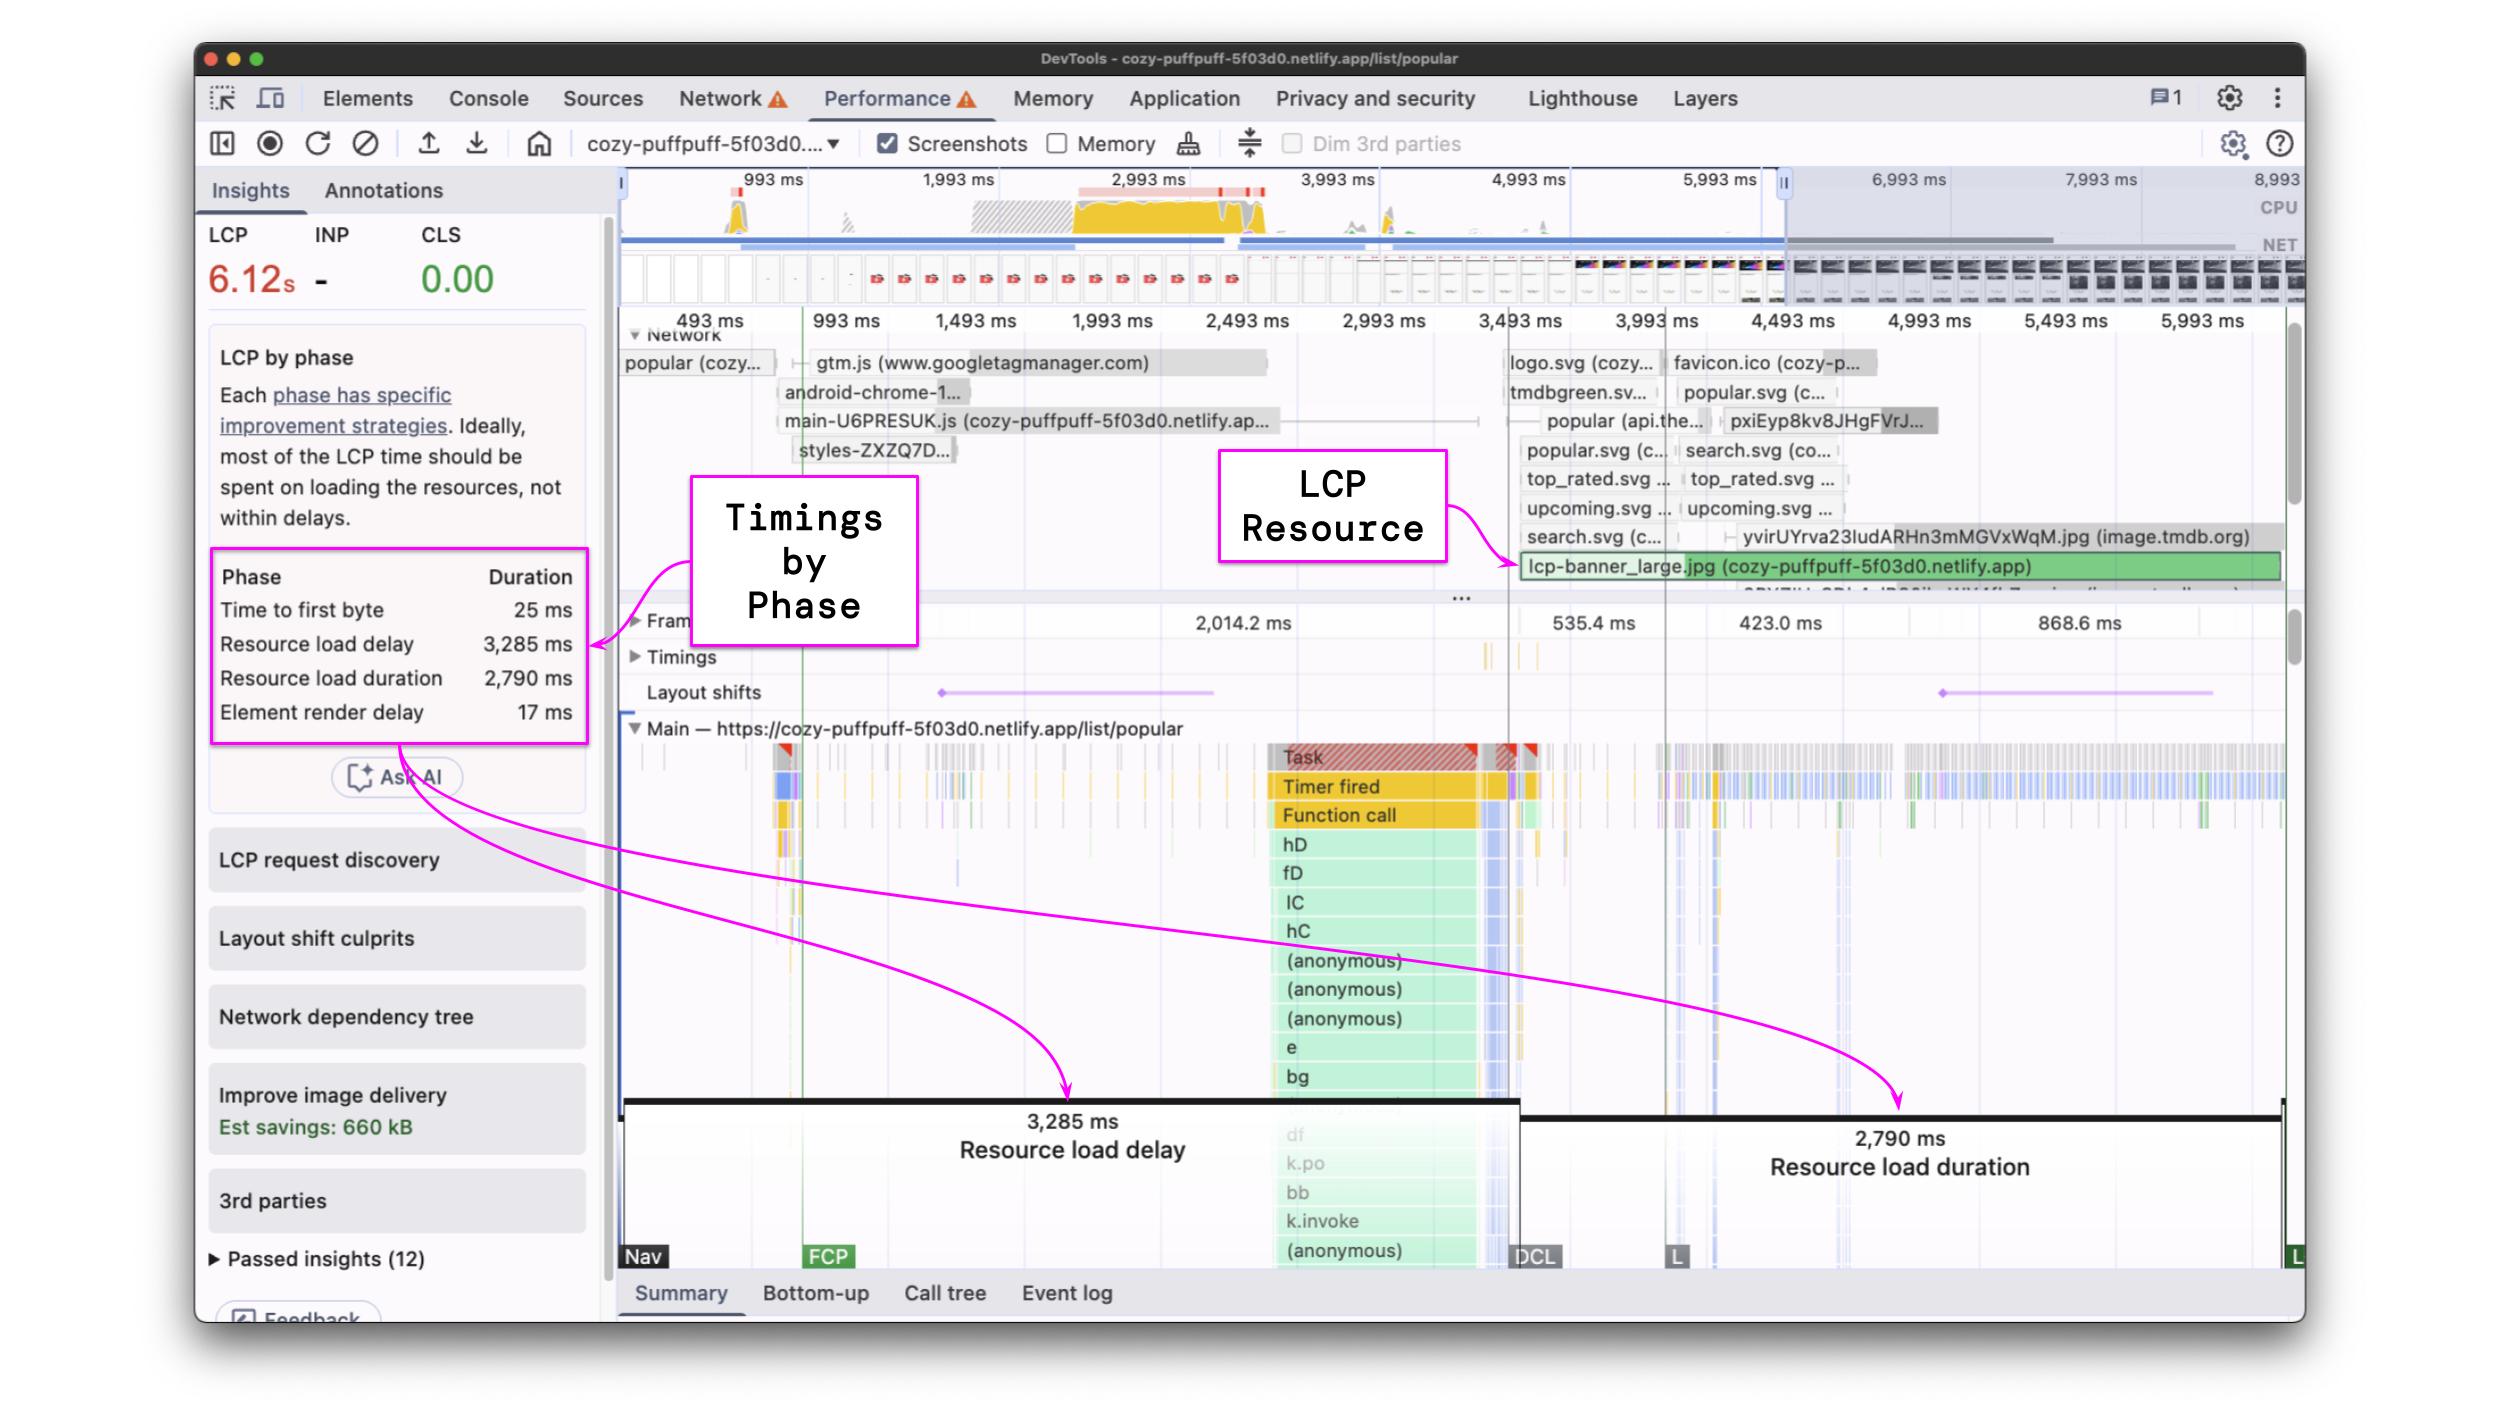
Additionally, the profile is annotated accordingly, and the LCP resource is highlighted. In our case, the LCP resource is lcp-banner_large.jpg
The audit reveals the following measurements:
Metric | Initial state |
Time to first byte | 25 ms |
Resource load delay | |
Resource load duration | |
Element render delay | 17 ms |
LCP |
Those numbers help us understand where our improvement opportunities are. In the above case, the bottleneck seems to come from the resource load delay combined with a high resource load duration.
Since one of the identified bottlenecks is the resource load delay, let's try the LCP request discovery audit. It highlights the request chain up to the LCP resource and gives suggestions to improve the discoverability of the LCP resource.
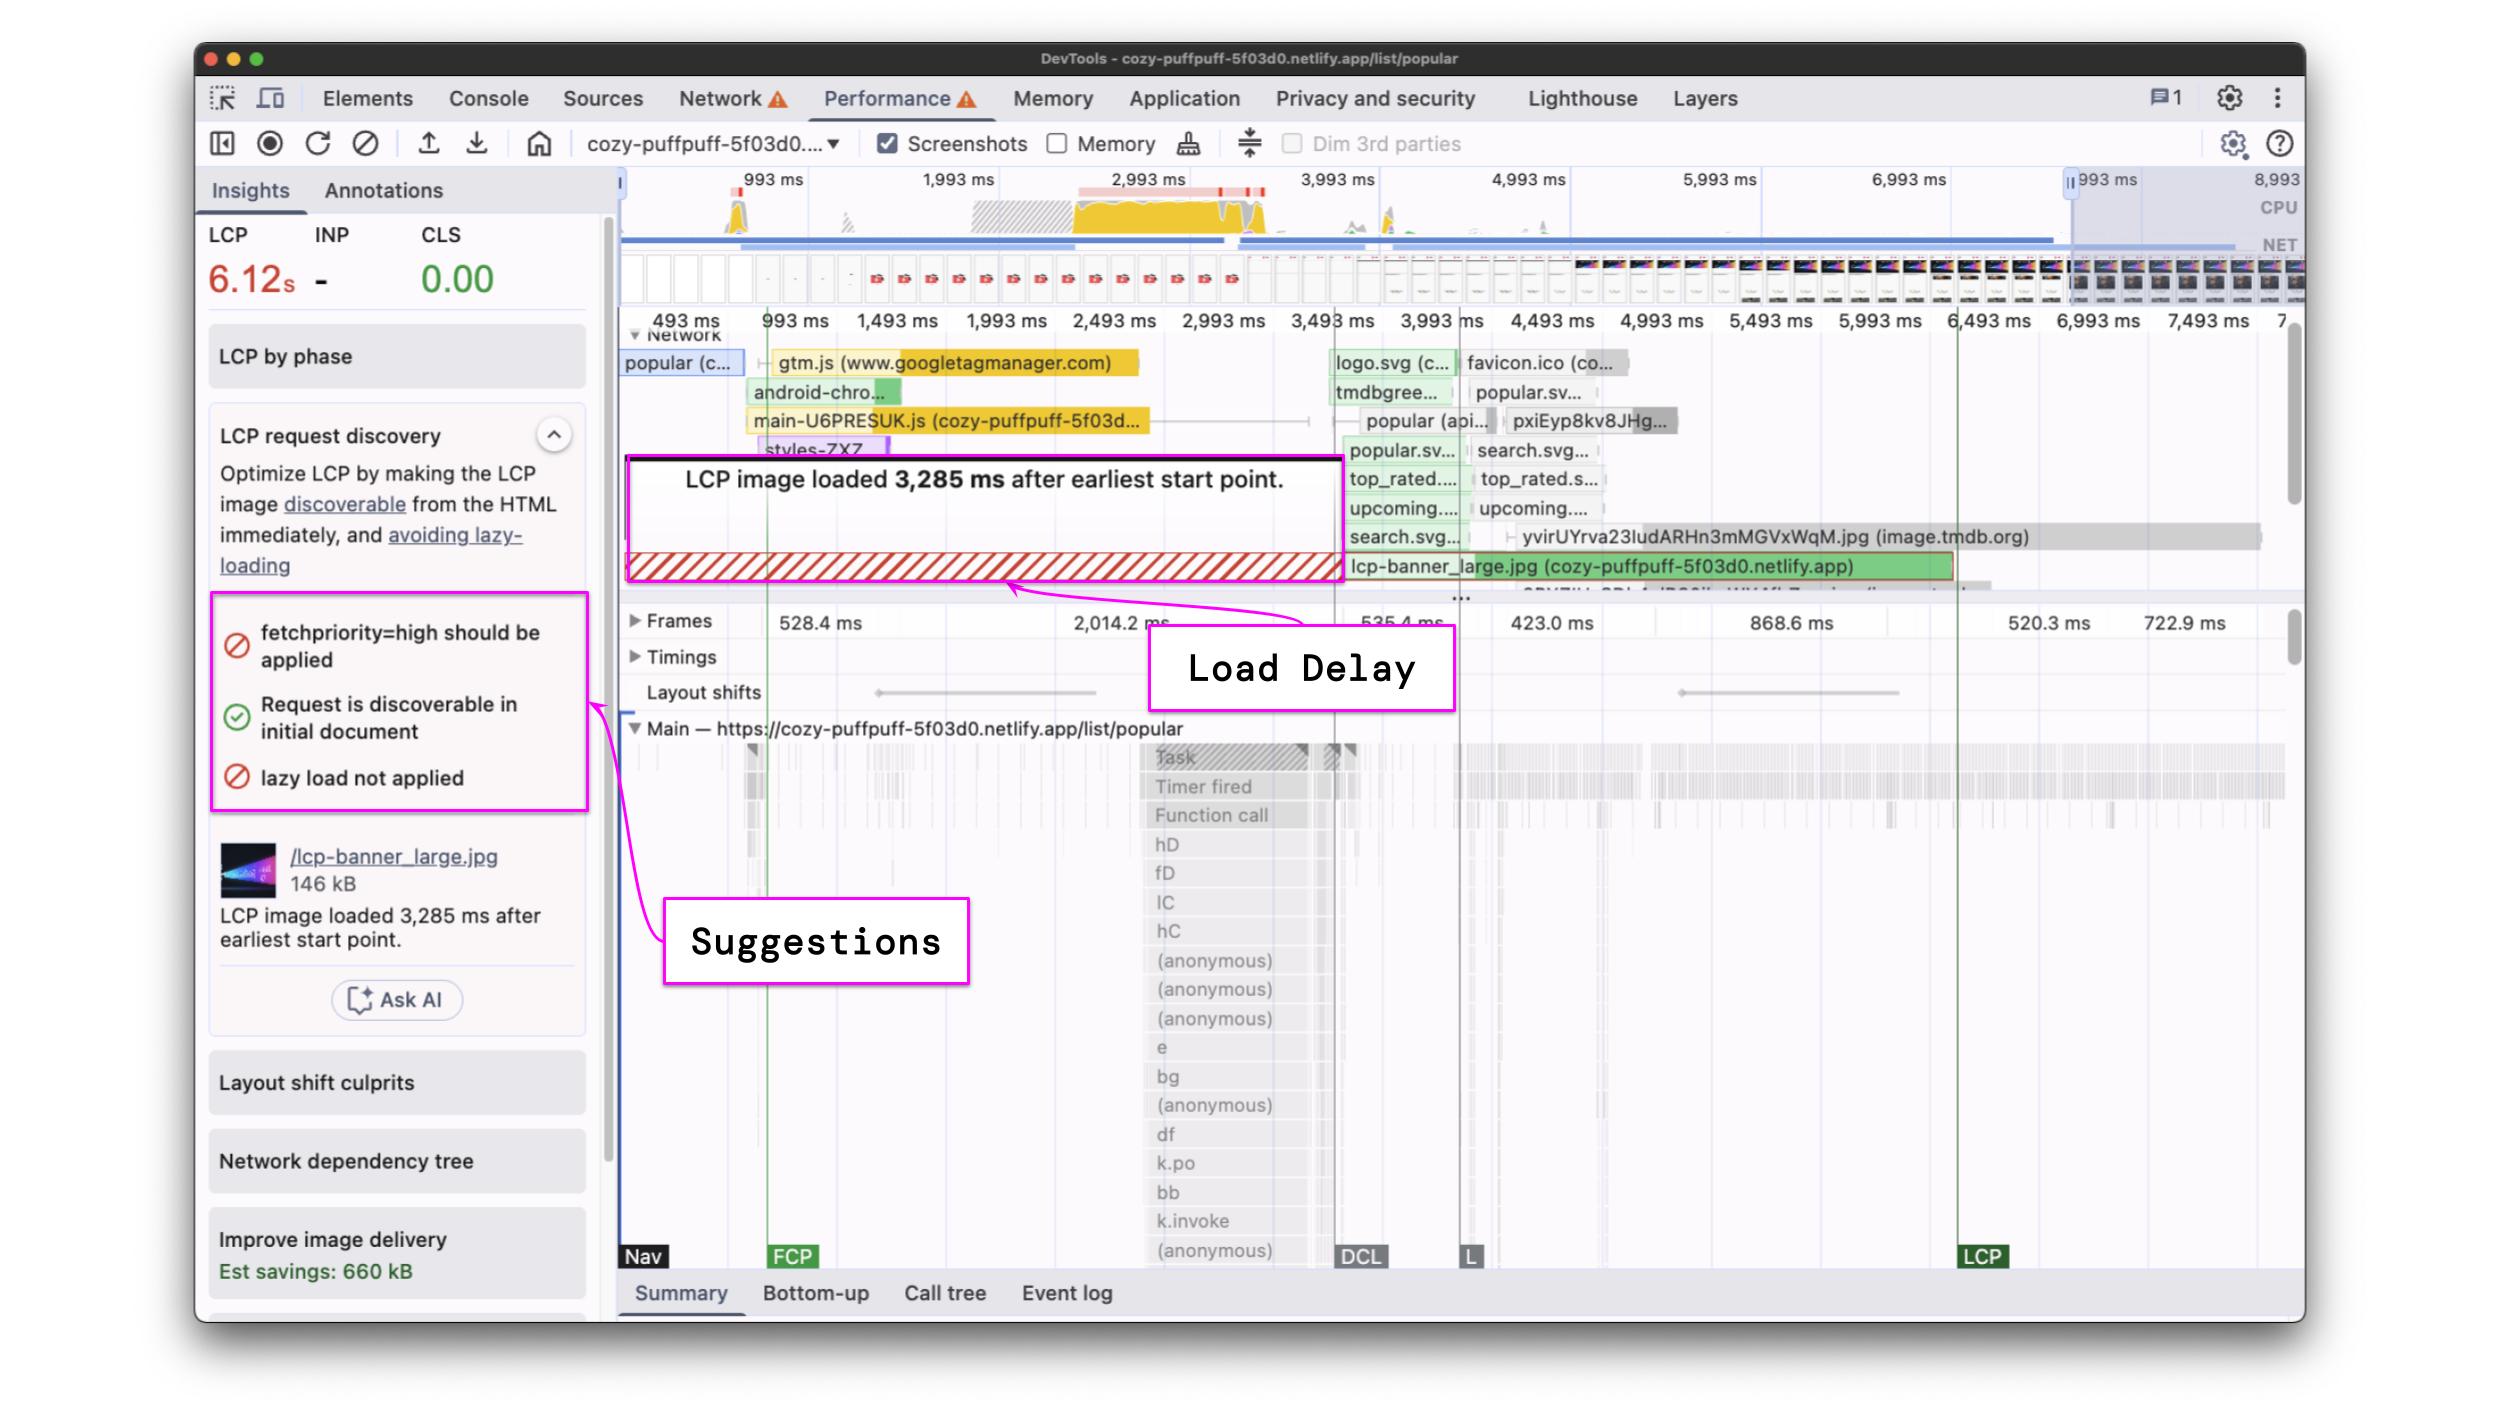
It tells us the current LCP resource is requested 3,285 ms after the earliest starting point. This is a good hint, as it suggests we should make sure to request the LCP resource as early as possible.
If your LCP isn’t where you want it to be, don’t stress.
Let’s focus on how to make use of measurements and how to improve LCP effectively. I'm going to walk you through the process of how a performance engineer applies and validates LCP improvements.
A quick recap of the measurements from the Performance Profiling section.
LCP Resource: lcp-banner_large.jpg
Metric | Initial state |
Time to first byte | 25 ms |
Resource load delay | |
Resource load duration | |
Element render delay | 17 ms |
LCP |
We’ve measured a high resource load delay as well as a high resource load duration, causing a bad LCP score of ~6.1 seconds.
We can apply what we’ve learned to tackle both of the issues. Starting with the resource load delay, the best option we have is to use the preload resource hint for our LCP resource.
Please note that values for TTFB may vary a lot from measurement to measurement due to the infrastructure where the demo is hosted and network conditions that are not always 100% stable.
We’ve already figured out that the LCP resource is lcp-banner_large.jpg. Let’s add the following snippet to our app to make sure it’s discoverable for the browser immediately.
GitHub commit: https://github.com/hoebbelsB/lcp-demo/commit/f2b06d17d627173478ba86328633d072defae46f
After introducing that change, let’s do another measurement to validate our improvement.
As displayed in the image above, the LCP value improved by about the amount of the resource load duration. This is because we’ve now eliminated the resource load delay, so the resource will be available immediately when being requested.
Metric | Initial State | Preload |
Time to first byte | 25 ms | 319 ms |
Resource load delay | 3 285 ms | |
Resource load duration | 2 790 ms | |
Element render delay | 17 ms | |
LCP |
Tip: When the LCP resource is not static
Please note that this example works with a static LCP resource that is well-known before the application bootstraps, which showcases the easiest route for improvements. When working with a dynamic LCP resource, fetch your data revealing the LCP resource as early as possible and dynamically insert a link rel=”preload”
The next bottleneck that is left over after the recent improvement is resource load duration. Reducing the resource load duration means improving the assets we are shipping to our users.
A common method for this is using the already mentioned srcset attribute. The srcset is not only available on images, but also on link tags to preload images.
For the sake of simplicity, we are going to use a set of 3 images for different display sizes and call them small, medium, and large.
We serve the small image for all screen sizes < 800px, the medium image for screen sizes >= 800px < 1500px, and the large image for screen sizes >= 2500px.
Of course, this setup could be as fine-grained as you want and is, for sure, not the most optimal configuration in this example.
The srcset needs to be applied to both the image tag itself and the preload link. Otherwise, the two sources won’t match, and the preloading will stop functioning.

GitHub commit: https://github.com/hoebbelsB/lcp-demo/commit/e92abe8bb2e87c6285620c85b813afb583a01c1f
With the above changes, I expect the resource load delay to significantly decrease. Based on our testing setup, the browser should now serve lcp-banner_medium.jpglcp-banner_large.jpg
We again confirm the improvement by creating another performance profile and running the LCP by phase audit.
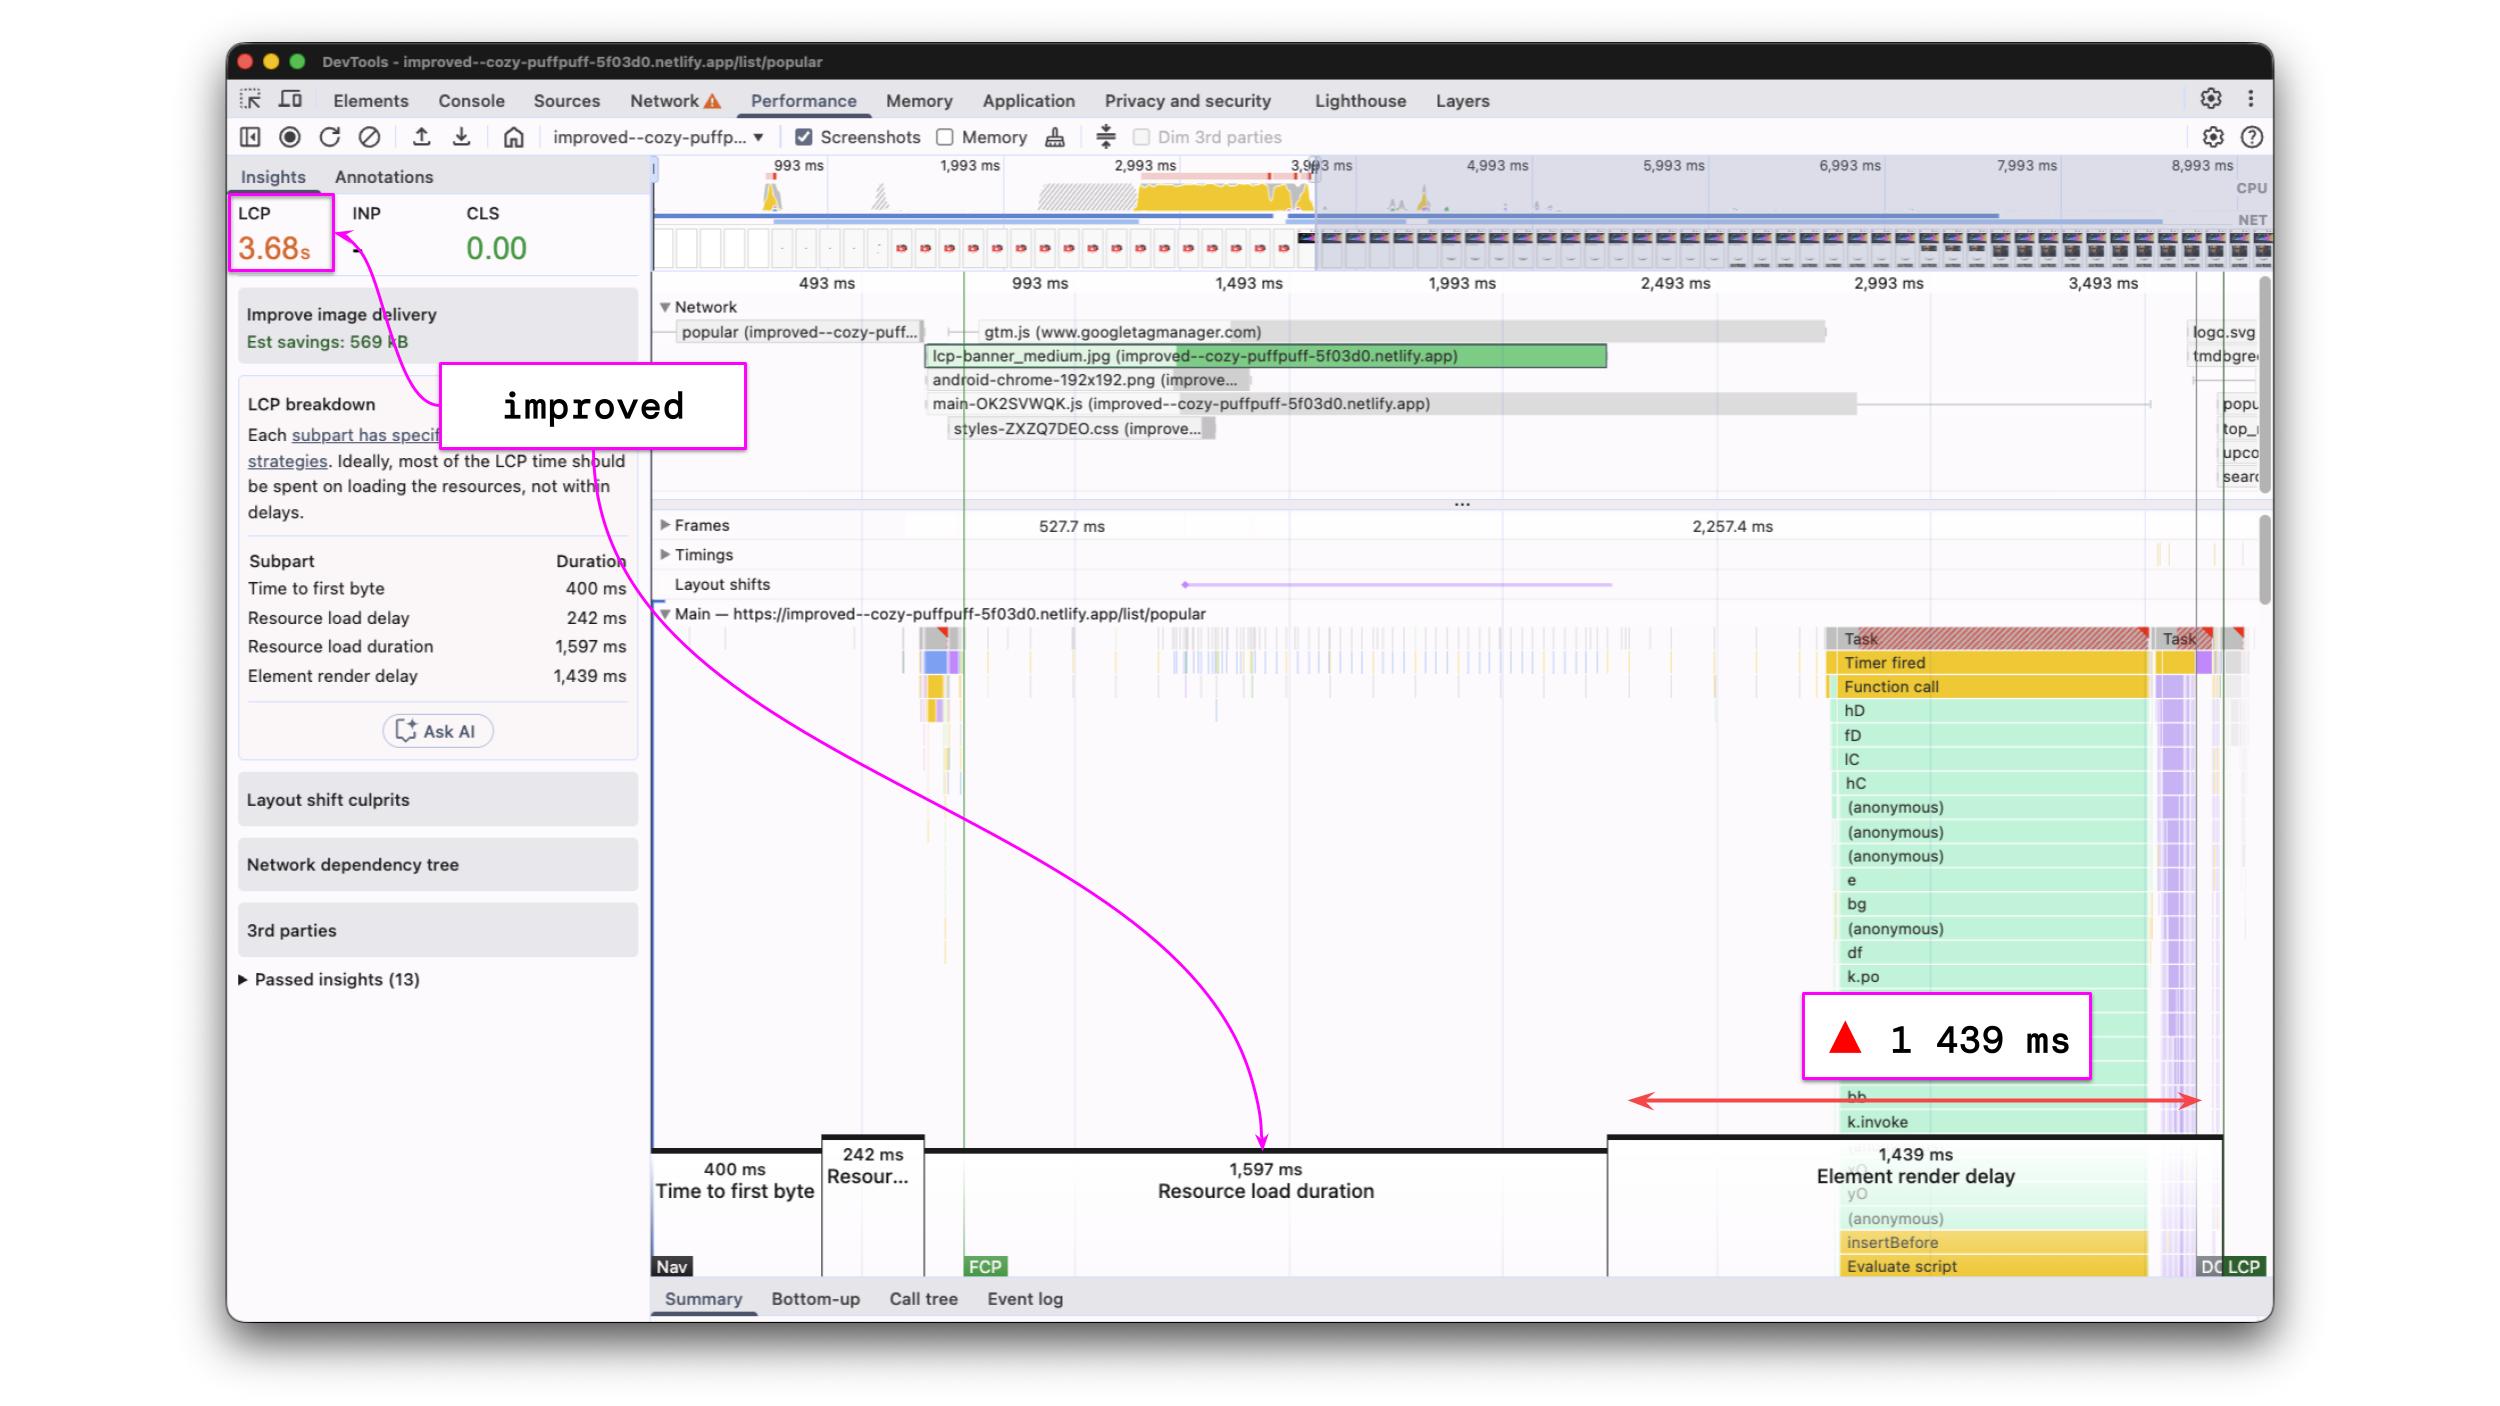
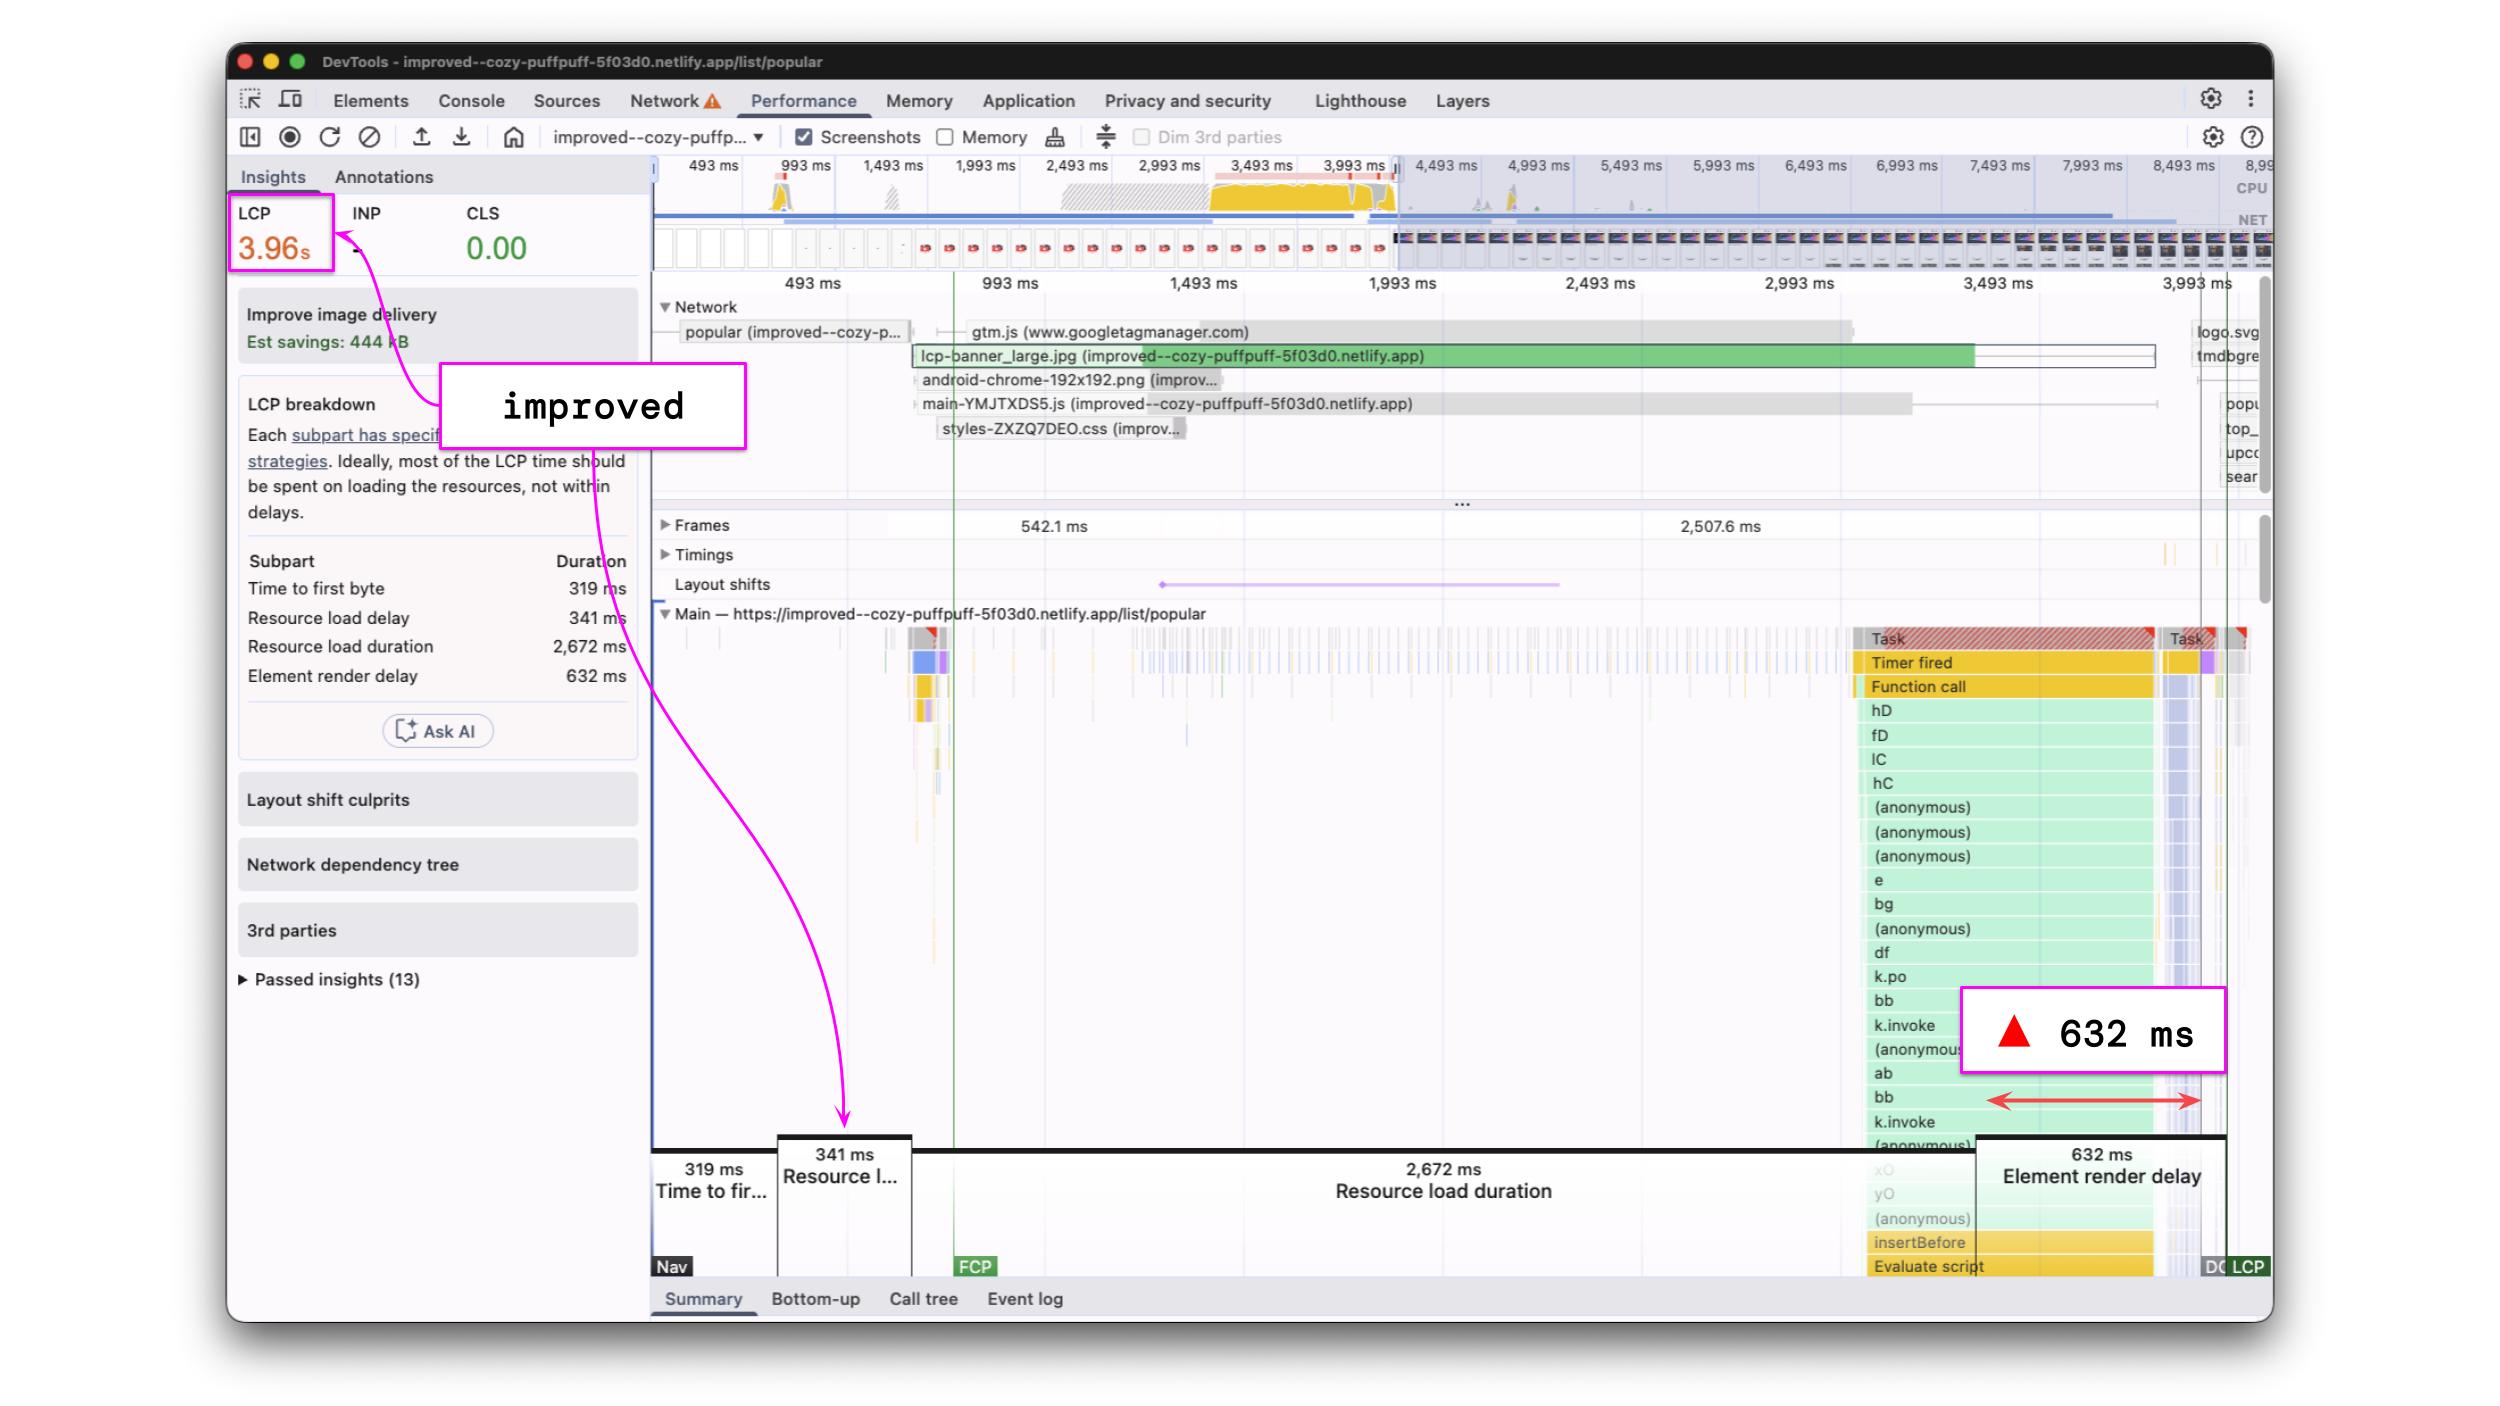
The profile shows exactly what was expected. The resource load duration decreased by around 1 000 ms as we are now serving a smaller asset.
However, the measured LCP didn’t reduce much - only around ~300 ms. This is due to the fact that we now switched our bottleneck from the resource itself to the element render delay, which increased by ~800 ms.
Metric | Initial State | Preload | srcset |
Time to first byte | 25 ms | 319 ms | 400 ms |
Resource load delay | 3 285 ms | ||
Resource load duration | 2 790 ms | ||
Element render delay | 17 ms | ||
LCP |
The table above is actually good news at this point. If we can reduce the element render delay to 0, we are in range of a green LCP.
Let’s analyse the performance recording on what opportunities we have to reduce the element render delay. We want to identify any bottleneck that is preventing us from displaying the LCP resource. The goal should be to load as little as possible, only what’s needed, and as early as possible to produce the largest contentful paint.
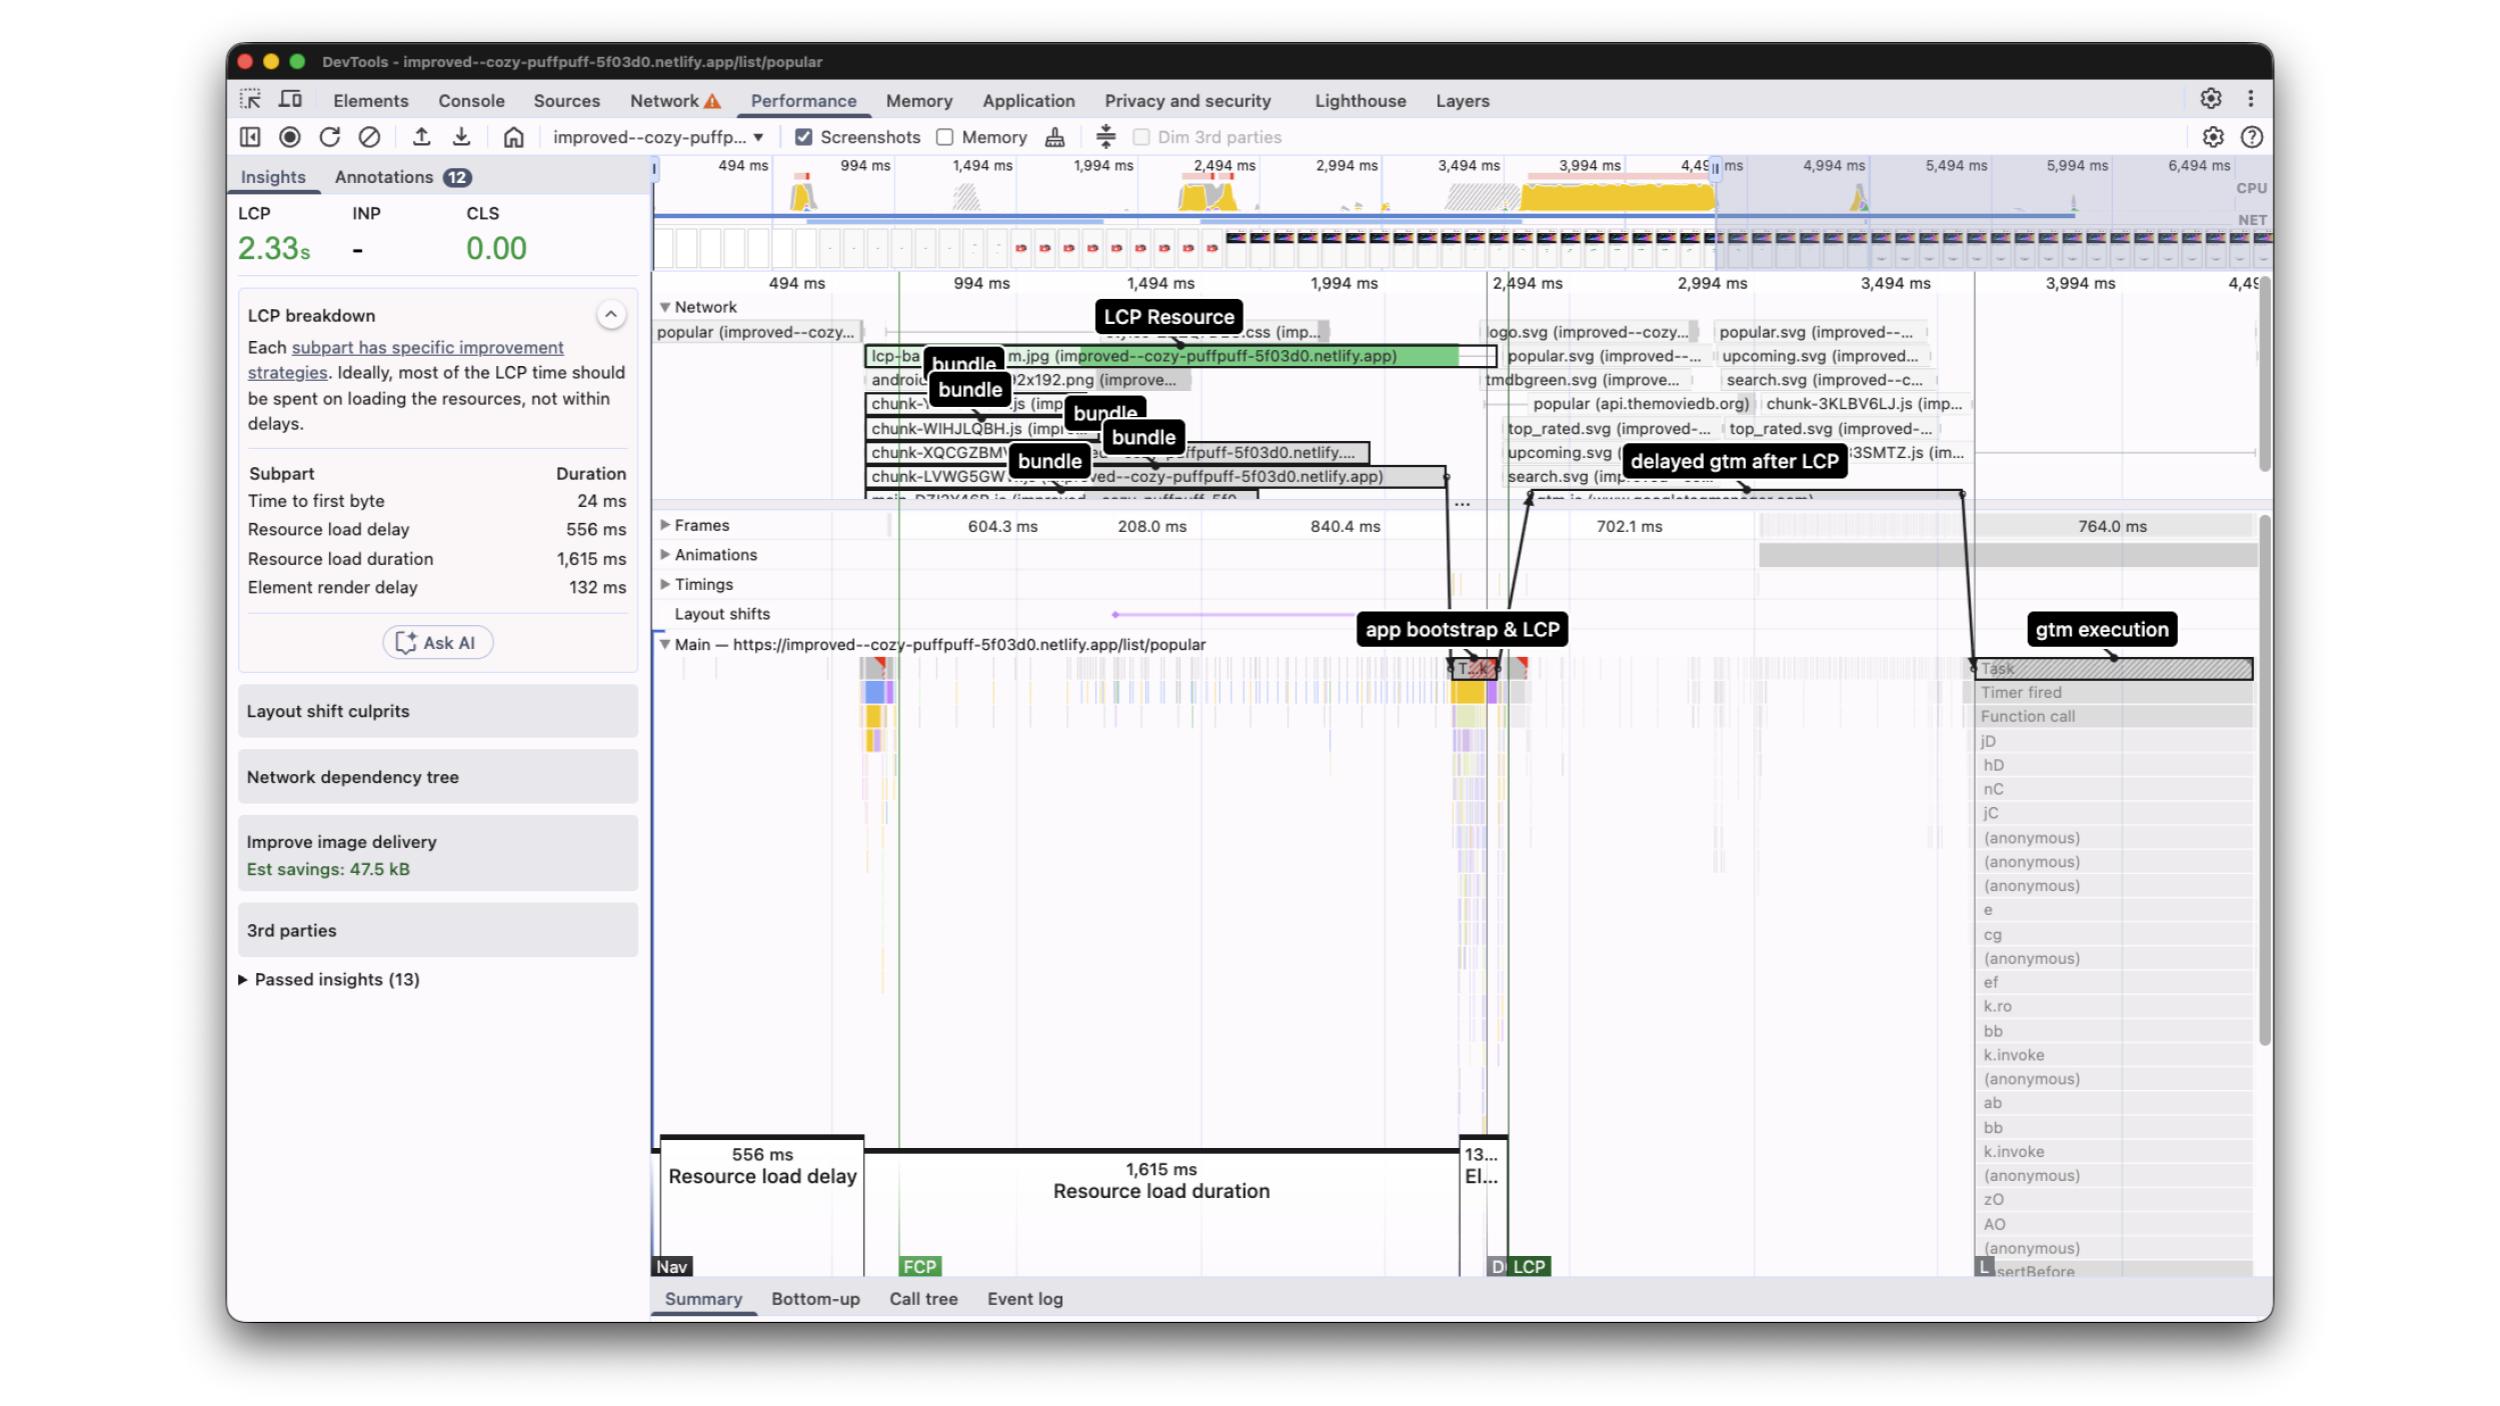
In the following profile, you see annotations for the most critical bottlenecks that prevent us from rendering our LCP resource early.
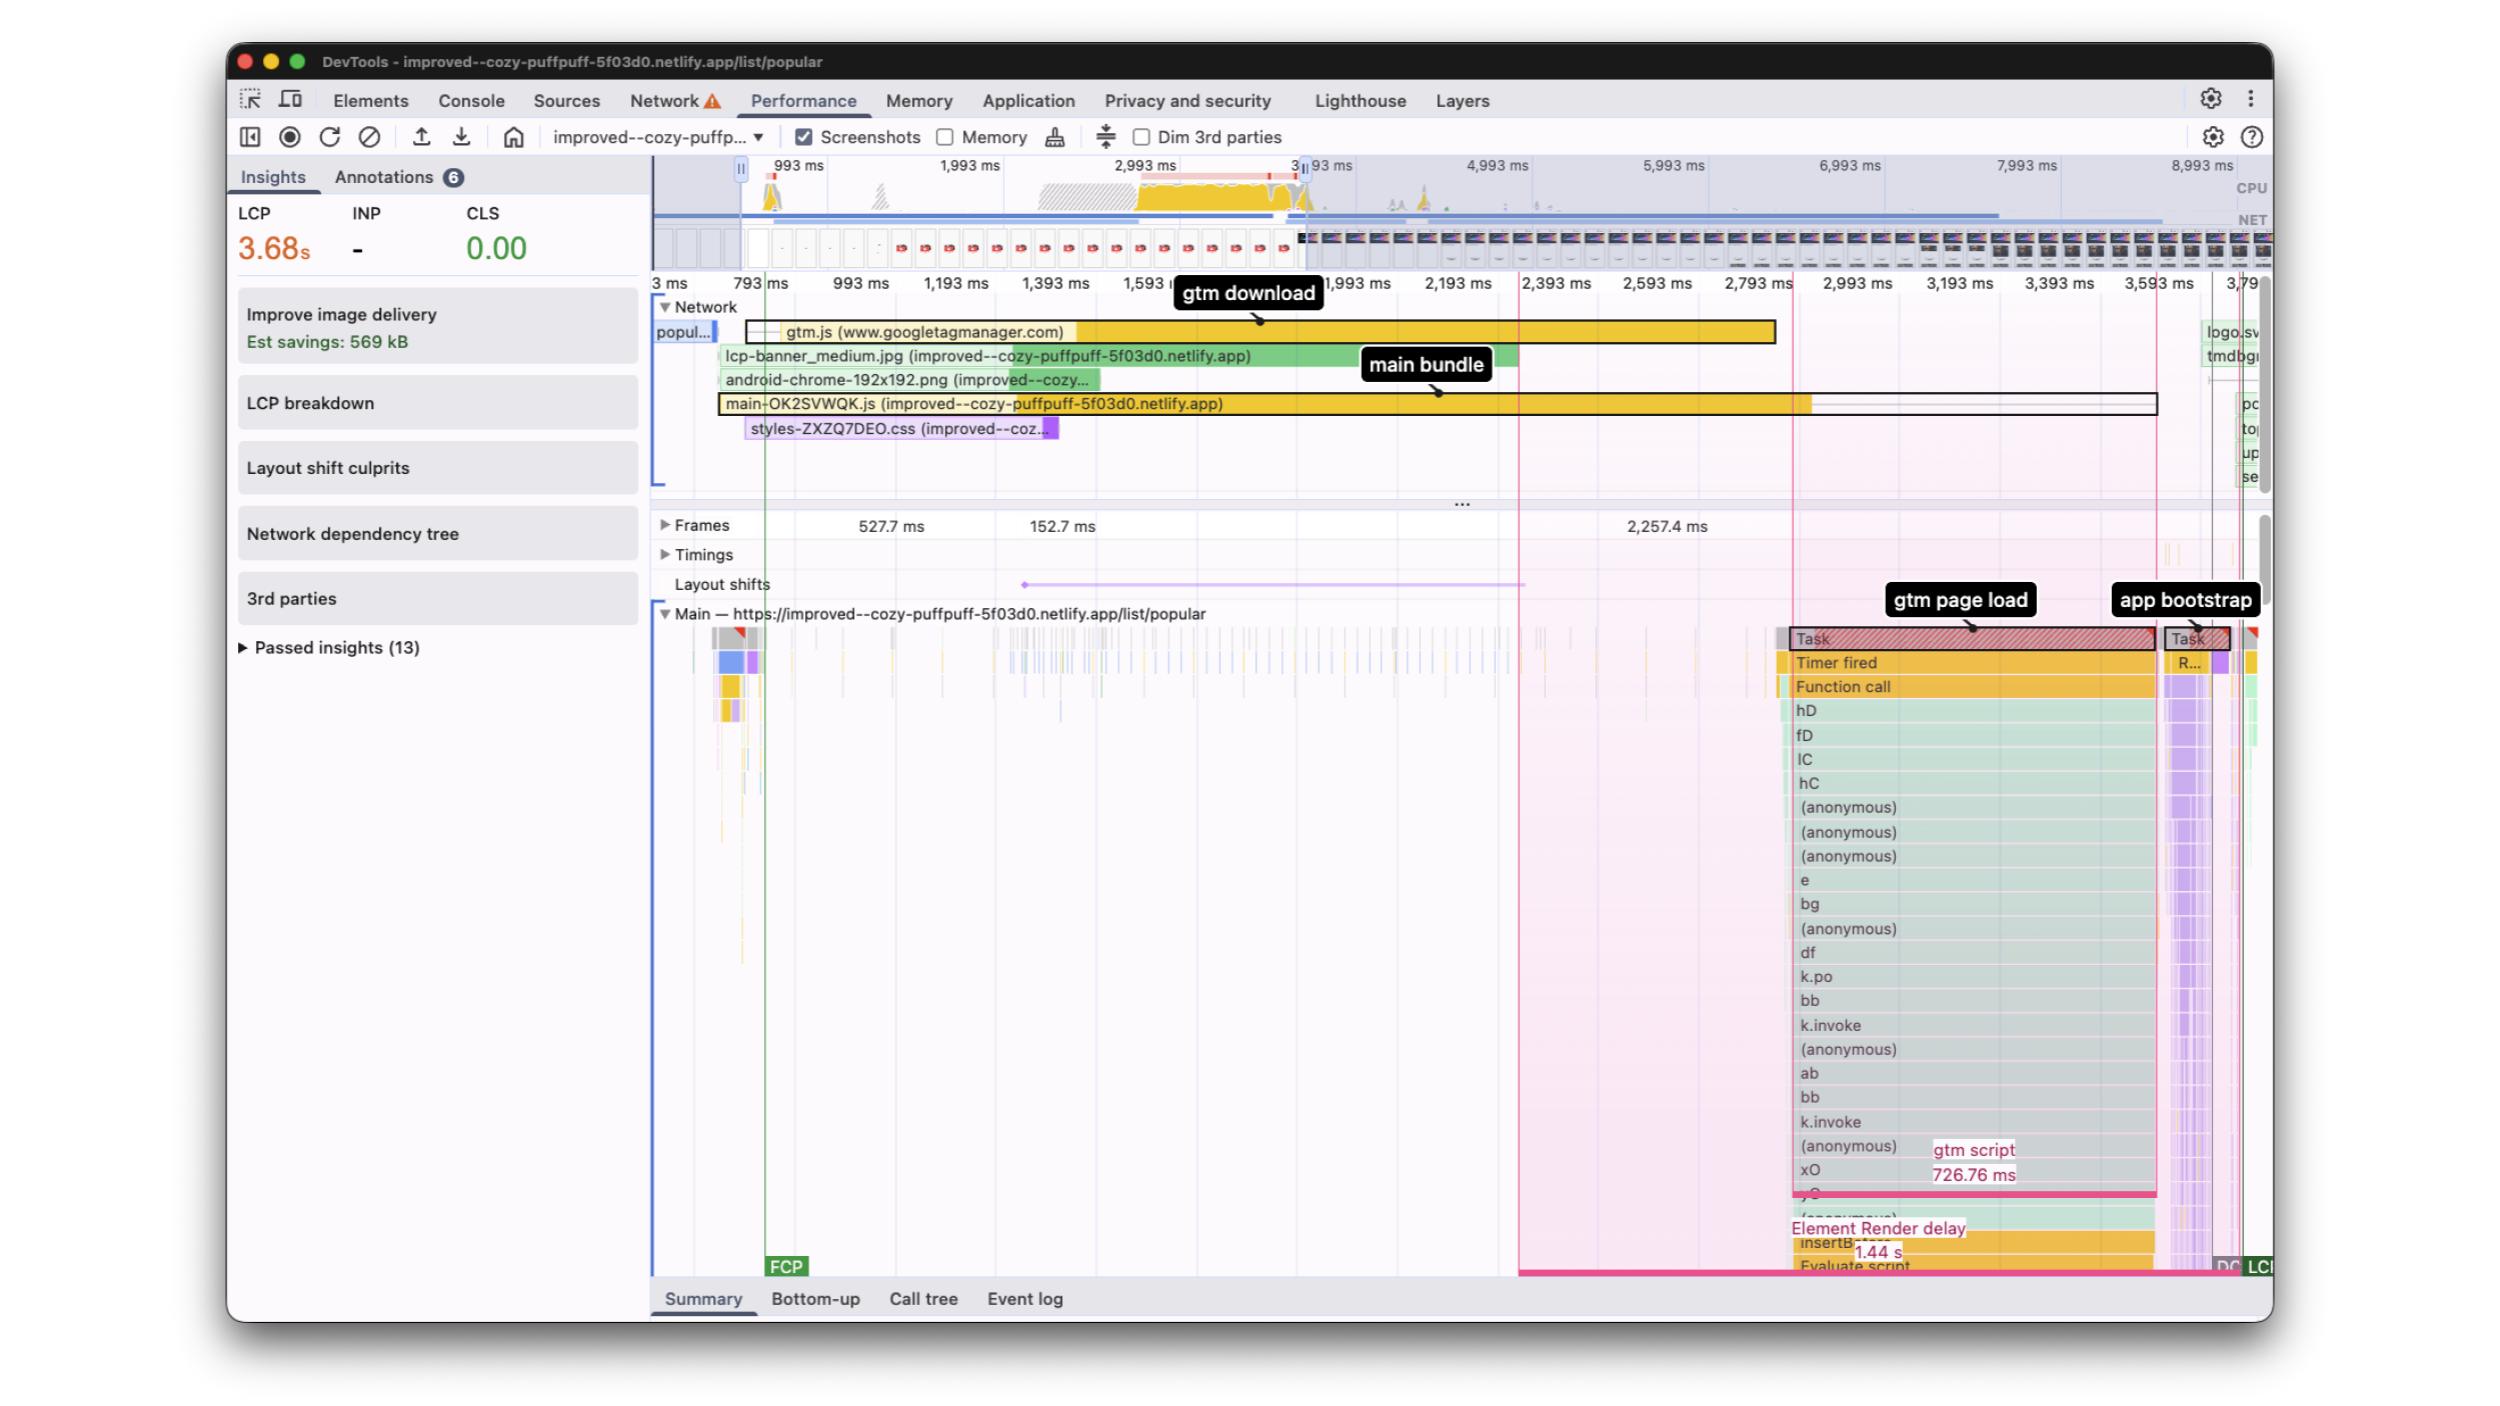
We can see that Google Tag Manager starts downloading as soon as the application launches. This process triggers a script that creates a ~700 ms blocking task. As a result, our first-party application doesn't even get a chance to begin bootstrapping until the task is completed.
Furthermore, we see the main JavaScript bundle download duration exceeding the duration of the LCP resource. This means the LCP resource will always have an element render delay equal to the diff between the LCP resource and the main bundle download duration.
What we should do now is to postpone the GTM script execution after the LCP candidate has been displayed and optimize our JavaScript bundle.
Delay 3rd parties
Let’s start by looking at how and when we are downloading our 3rd party scripts. Google Tag Manager and other 3rd parties are typically inserted into the head of the index.html, causing them to be parsed immediately.
The above snippet adds the script tag to download the actual gtm.js dynamically and produces the following output:
Scripts added to the index.html, even though using the async
A potential improvement could be to download the 3rd party scripts after the LCP event has been settled.
See the following code snippet that makes use of the PerformanceObserver API to dynamically inject the GTM script into the head after the LCP has been fired.
const lcpObserver = new PerformanceObserver((events) => {
  if (events.getEntries().length > 0) {
    const gtmScript = document.createElement('script');

    gtmScript.text = `
        (function(w,d,s,l,i){w[l]=w[l]||[];w[l].push({'gtm.start':
      new Date().getTime(),event:'gtm.js'});var f=d.getElementsByTagName(s)[0],
    j=d.createElement(s),dl=l!='dataLayer'?'&l='+l:'';j.async=true;j.src=
    'https://www.googletagmanager.com/gtm.js?id='+i+dl;f.parentNode.insertBefore(j,f);
  })(window,document,'script','dataLayer','{containerId}');`;

    gtmScript.type = 'text/javascript';
    document.head.appendChild(gtmScript);
    lcpObserver.disconnect();
  }
});

lcpObserver.observe({ type: 'largest-contentful-paint', buffered: false });
GitHub commit: https://github.com/hoebbelsB/lcp-demo/commit/74c3e701cd063bc77c89e21cae4a27597297b296
Let’s create another profile to validate the improvement. We can expect the LCP to go very close to the green range now.
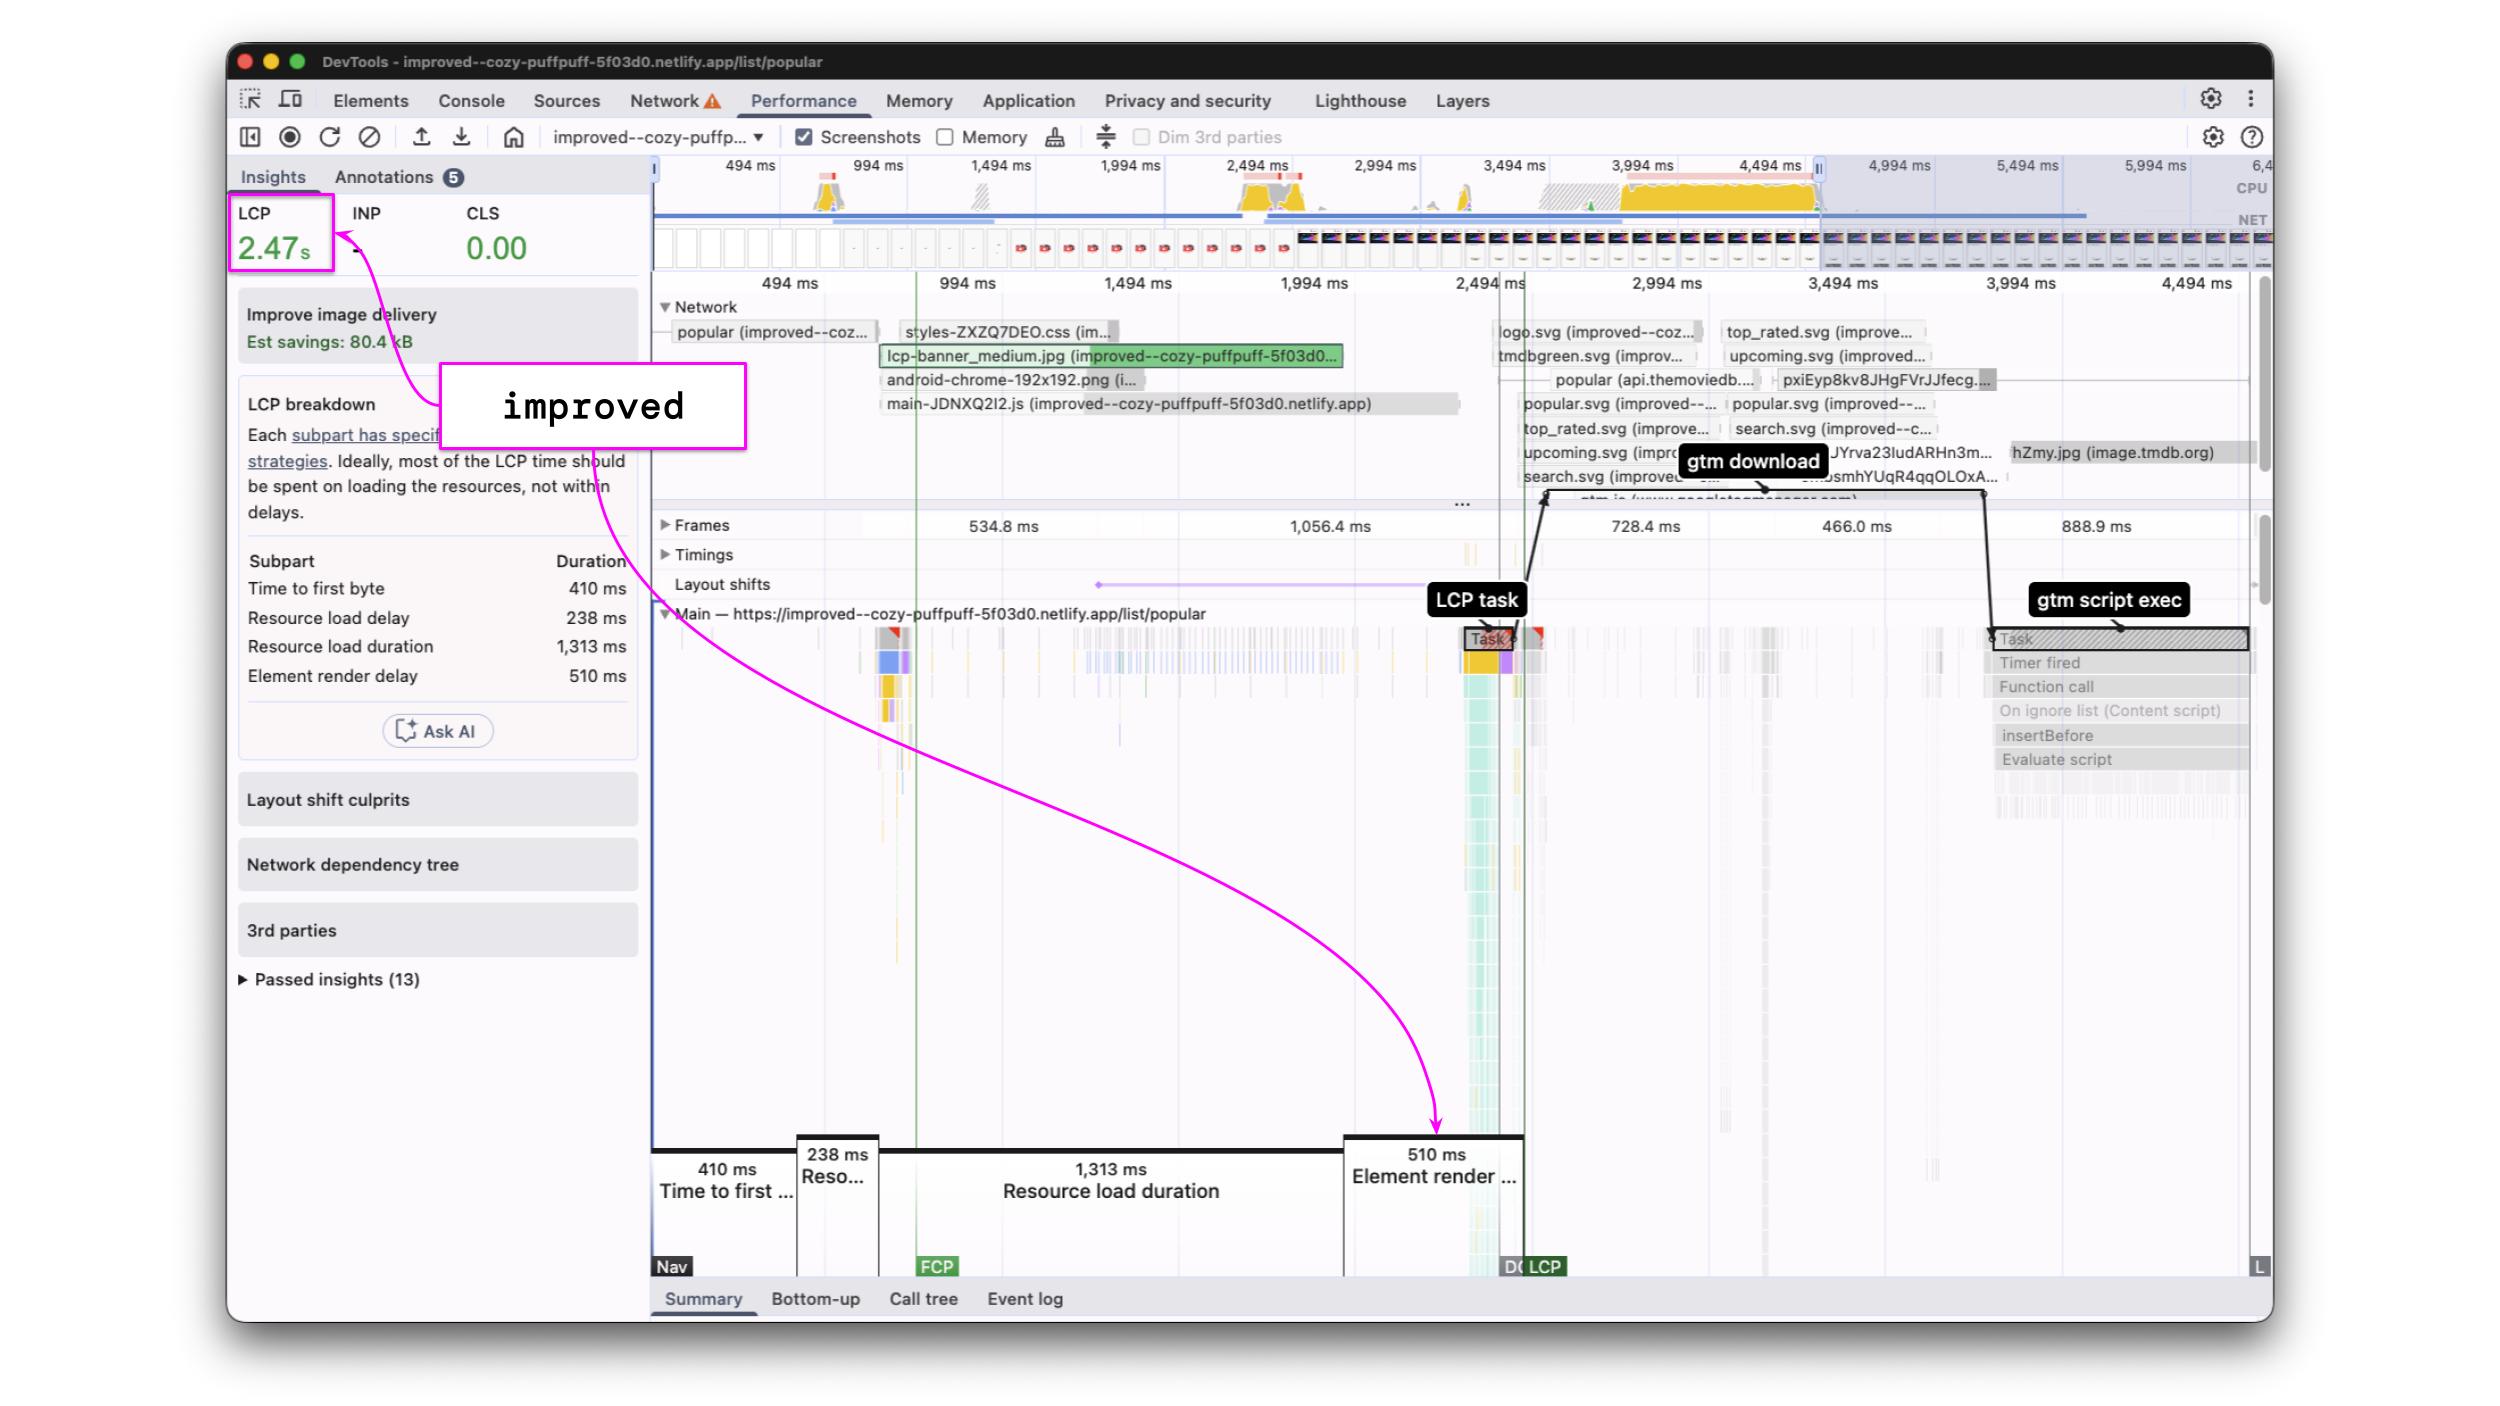
The profile clearly shows how the improvement paid off. The gtm.js script download starts after the LCP event, freeing up network resources as well as the main thread.
Finally, the LCP is green 🎉🚀!
Metric | Initial State | Preload | srcset | 3rd party delay |
Time to first byte | 25 ms | 319 ms | 400 ms | 410 ms |
Resource load delay | 3 285 ms | |||
Resource load duration | 2 790 ms | |||
Element render delay | 17 ms | |||
LCP |
As expected, element render delay remains an issue due to the JavaScript bundle we have to download. Even though LCP is green already, we can try to squeeze out more.
Bundle size improvement
As a final improvement, we want to reduce the amount of 1st party JavaScript that needs to be downloaded and processed before displaying the LCP resource.
This requires us to analyze the bundle size of our application and to make sure to download only the critical resources needed for the largest contentful paint.
Our example application is a simple Angular app. We can easily introduce code splitting by using router-level lazy loading or by using the @defer block.
See the following snippets that were used to improve this example application.
Router lazy loading
// src/app/app.routes.ts
{
    path: 'movie/:id',
    loadComponent: () => // 👈 added lazy loading for feature components
      import('./movie/movie-detail-page/movie-detail-page.component').then(
        (m) => m.MovieDetailPageComponent,
      ),
  },
  {
    path: 'search/:query',
    loadComponent: () =>
      import('./movie/movie-search-page/movie-search-page.component').then(
        (m) => m.MovieSearchPageComponent,
      ),
  },
GitHub commit: https://github.com/hoebbelsB/lcp-demo/commit/67ac10dcd5acdcd791578c0df2264343df1d9c94
The above changes should result in a decreased initial bundle size and cause the bundled code to be split up into multiple modules that can be downloaded in parallel.
Again, we validate the changes by creating and analyzing a performance profile.
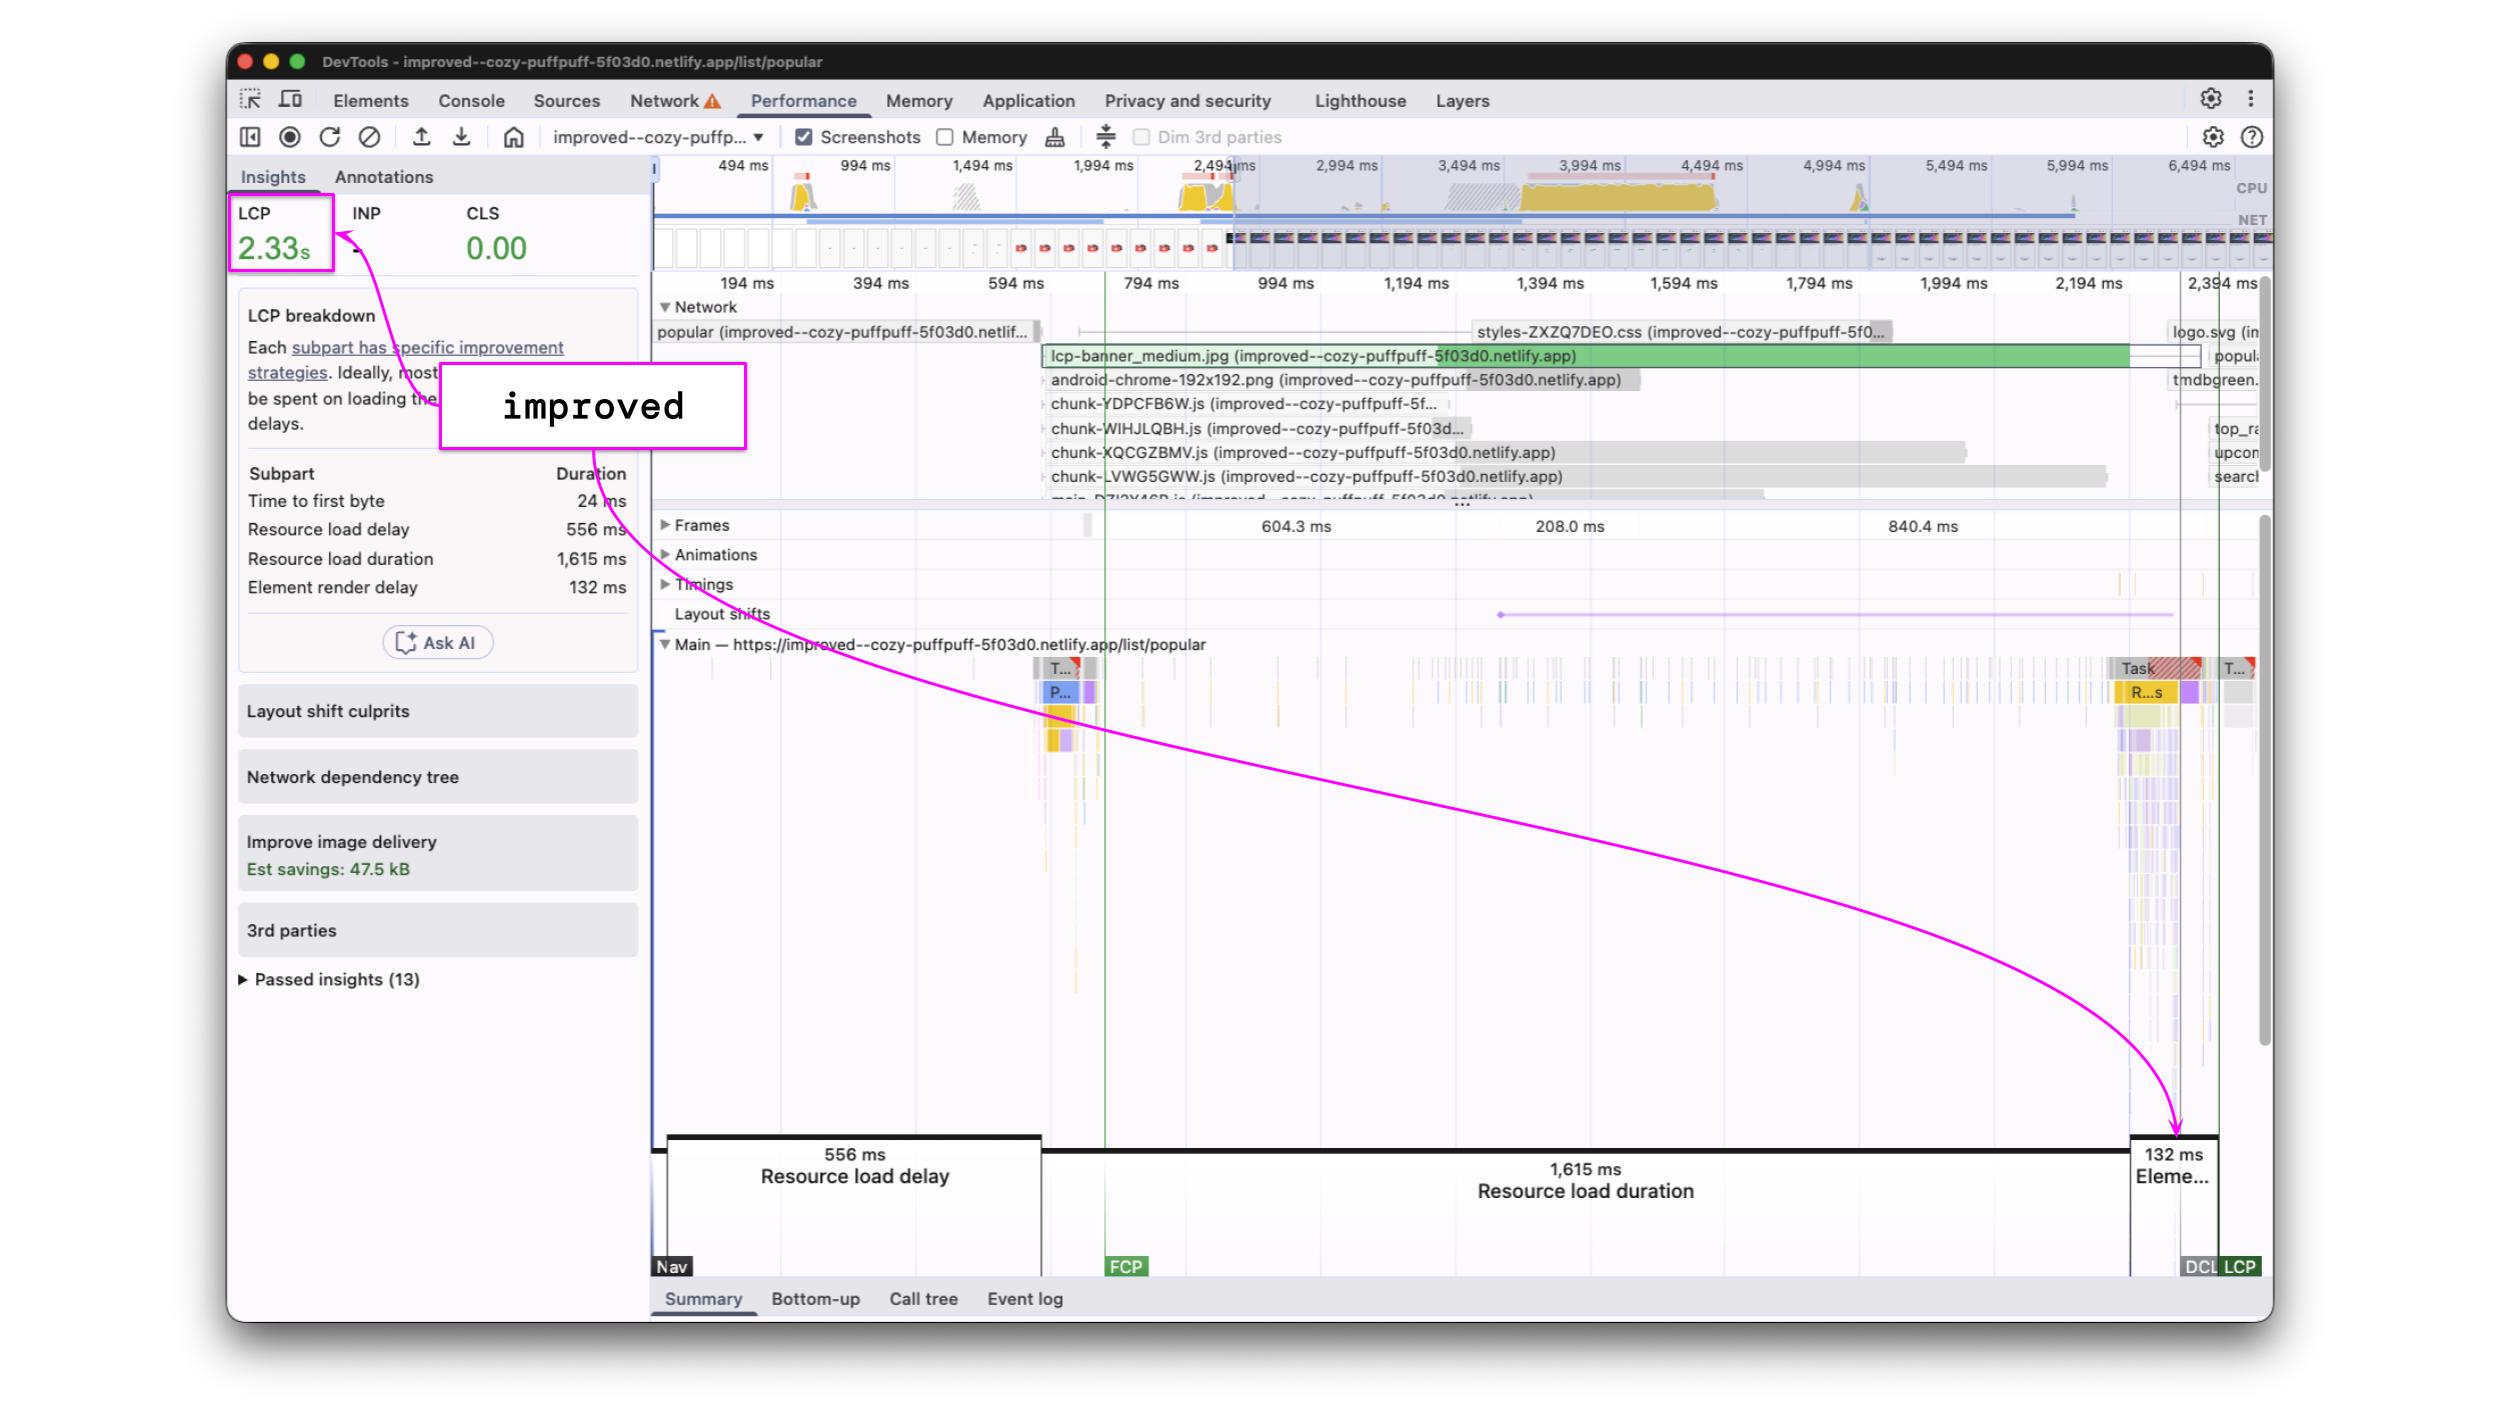
The plan to reduce the element render delay worked out. Instead of a single main.js, we are now downloading 5 JavaScript chunks in parallel.
LCP improved again, and we are well below the 2 500 ms threshold.
Metric | Initial State | Preload | srcset | 3rd party delay | bundle size |
Time to first byte | 25 ms | 319 ms | 400 ms | 410 ms | 22 ms |
Resource load delay | 3 285 ms | ||||
Resource load duration | 2 790 ms | ||||
Element render delay | 17 ms | ||||
LCP |
While LCP again improved, it didn’t decrease as much as expected. It could be related to network or server conditions. We have to remind ourselves that the images are served from the same origin as the JavaScript. Using a dedicated CDN might reduce the resource load duration.
With the techniques mentioned above, we’ve gradually and strategically improved LCP from an initial state of 6 120 ms down to 2 330 ms, which is a reduction of 61.6%. Remember that all measurements were taken with Slow 4G network throttling.
The above example showcased how to gradually improve LCP by combining multiple different techniques. There is no silver bullet to fix performance issues. Introducing an improvement in one area can reveal new bottlenecks in another.
Feel free to validate all measurements on your own.
Apps
Improvement commits & performance profiles
Improvement / Measurement | Profile | Commit |
|---|---|---|
Initial State | ||
Preload LCP Image | ||
Asset optimization | ||
Delay 3rd parties | ||
Bundle optimizations |
Optimize Time to First Byte (TTFB):
Address server-side issues.
Implement caching and serve content from the edge (CDNs).
Reduce Resource Load Delay:
Eagerly load LCP resources with fetchpriority="high" and loading="eager".
Use preload resource hints for critical LCP images.
Reduce JavaScript and CSS bundle sizes.
Consider Server-Side Rendering (SSR) for frontend frameworks.
Minimize Resource Load Duration:
Compress and optimize image and video assets (e.g., using Squoosh).
Utilize srcset for responsive image delivery, serving appropriate resolutions for different devices.
Decrease Element Render Delay:
Optimize bundle size through feature lazy loading and code splitting.
Analyze and defer non-critical third-party scripts (e.g., using PerformanceObserver).
Fetch data needed for LCP resources as early as possible.
Advanced workshop
High-Speed Angular applications on any device
Learn more
Largest Contentful Paint (LCP) is a Core Web Vital that shapes user perception of speed. This first part explains what LCP is why it matters for SEO and business, and how its phases affect site performance.

Profiling is easiest when it's real. Learn how to capture and make sense of CPU profiles in Node.js across scripts, threads, and processes—then apply it to your own projects.

CPU profiles are more than flame charts—they’re structured JSON files. Learn how nodes, samples, and time deltas form the backbone of DevTools performance data.
Get deeper insights into your Node.JS performance. Learn how to master advanced CPU profiling with built-in tools, interpret process/thread IDs, and optimize using sampling intervals. Troubleshooting and real examples included.

Angular is bridging the gap between the new Signal-Forms architecture and the Template/Reactive Forms. This isn't just a minor update—it’s a fundamental shift in how we author custom form controls.


A small performance audit including thought processes and methodology