
High-Speed Web Applications
About the event
The Chrome DevTools are a powerful addition to the developer’s toolset that allows finding and eliminating your app’s performance bottlenecks. It is packed with features perfect for auditing page performance and deriving actionable insights. By visualizing data at a proper level of abstraction, it can help you pinpoint performance-related issues and set a baseline from which to start introducing improvements.
That said, knowing how to run performance tests on your web application properly is one thing, and putting those metrics to good use is another. Both aspects are critical to the overall success of the endeavor. Thus it is so crucial to understand all the ins and outs of performance data and performance tooling.
This might sound like a lot but don’t be put off! Over the course of this training, we will walk through the pitfalls and tricks of the trade of Chrome DevTools to provide you with a complete roadmap for performance analysis and optimization.
Chrome Developer Tools should be seen as a fount of knowledge about your app performance that anyone can benefit from. At that realization, the best part begins – experimenting and finding the most effective ways to improve the application’s speed.
Takeaways
Measurement & Metrics
Web Vitals – what they are and how to measure them
Network analysis and request debugging
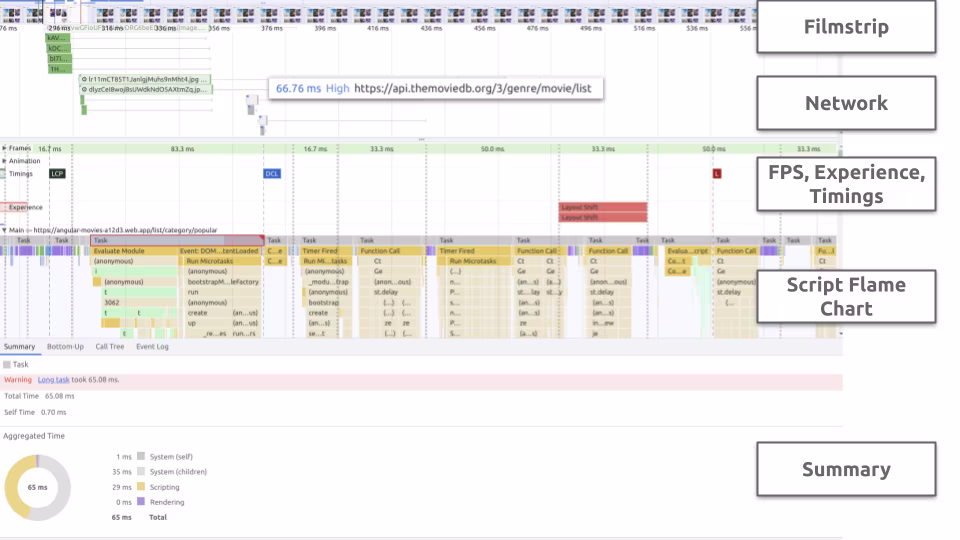
How to read the performance timeline
Rendering & Layout
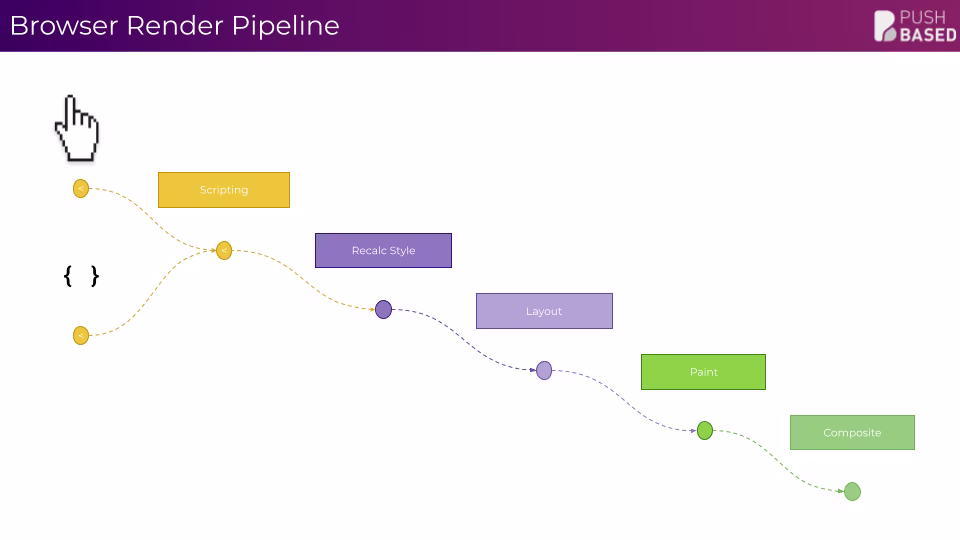
The browser's rendering pipeline
HTML structures, their styling and rendering in a browser
The Paint Flash APIs and scroll performance issues
Layer composition, layer squashing, and reflow triggers
JavaScript Runtime
Scripting, parsing, and prioritization
Frame drop, and why we should care about it
Scheduling techniques and scheduling priority
Main thread scheduling and non-blocking UIs
Agenda
Browser Fundamentals & JS Runtime
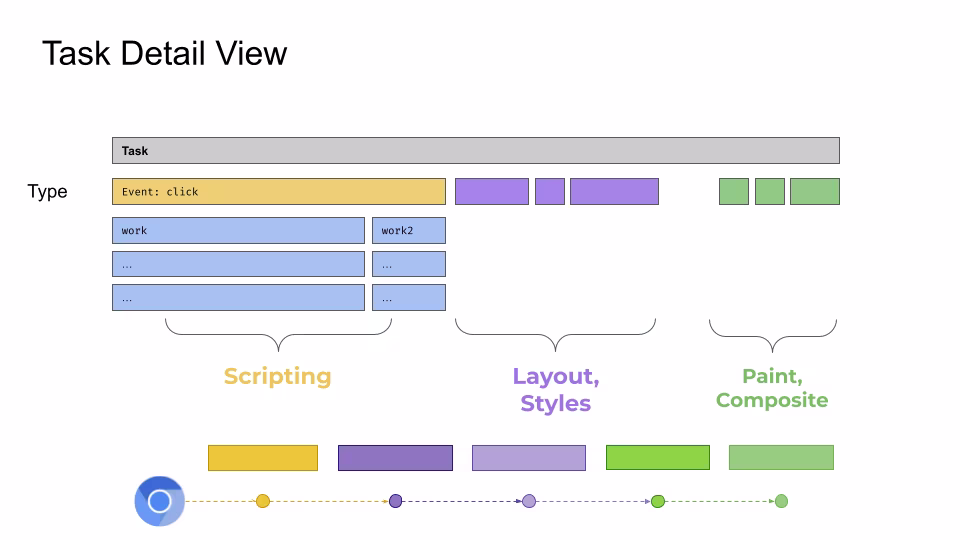
The browser render pipeline
Understand how the browser processes the code you write
Runtime performance of scripting, rendering, and painting
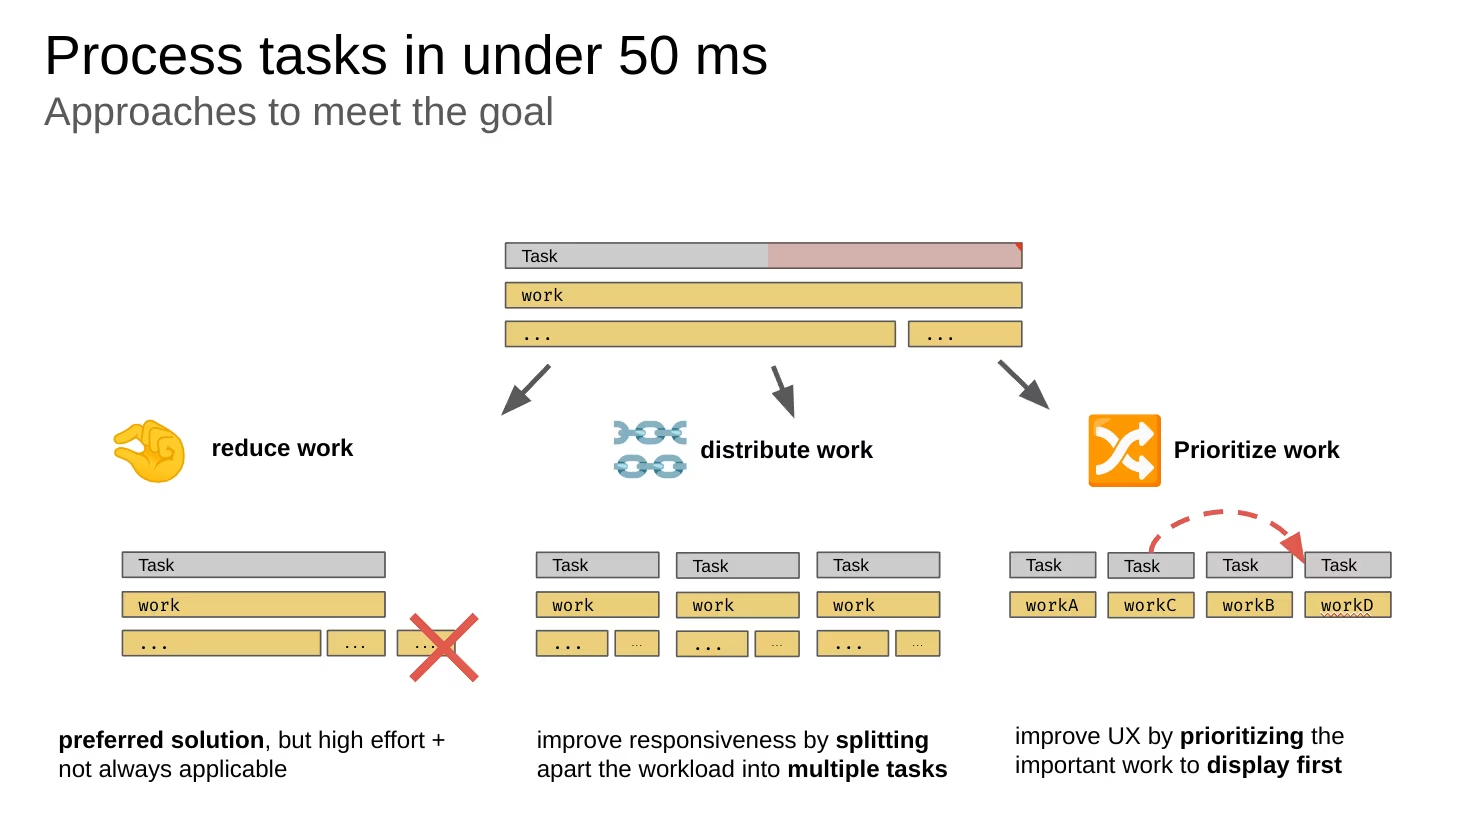
Minimize the work the browser needs to do
(Core) Web Vitals
What is the performance score?
LCP, INP and CLS as well as all other important metrics
How to measure and improve web vitals?
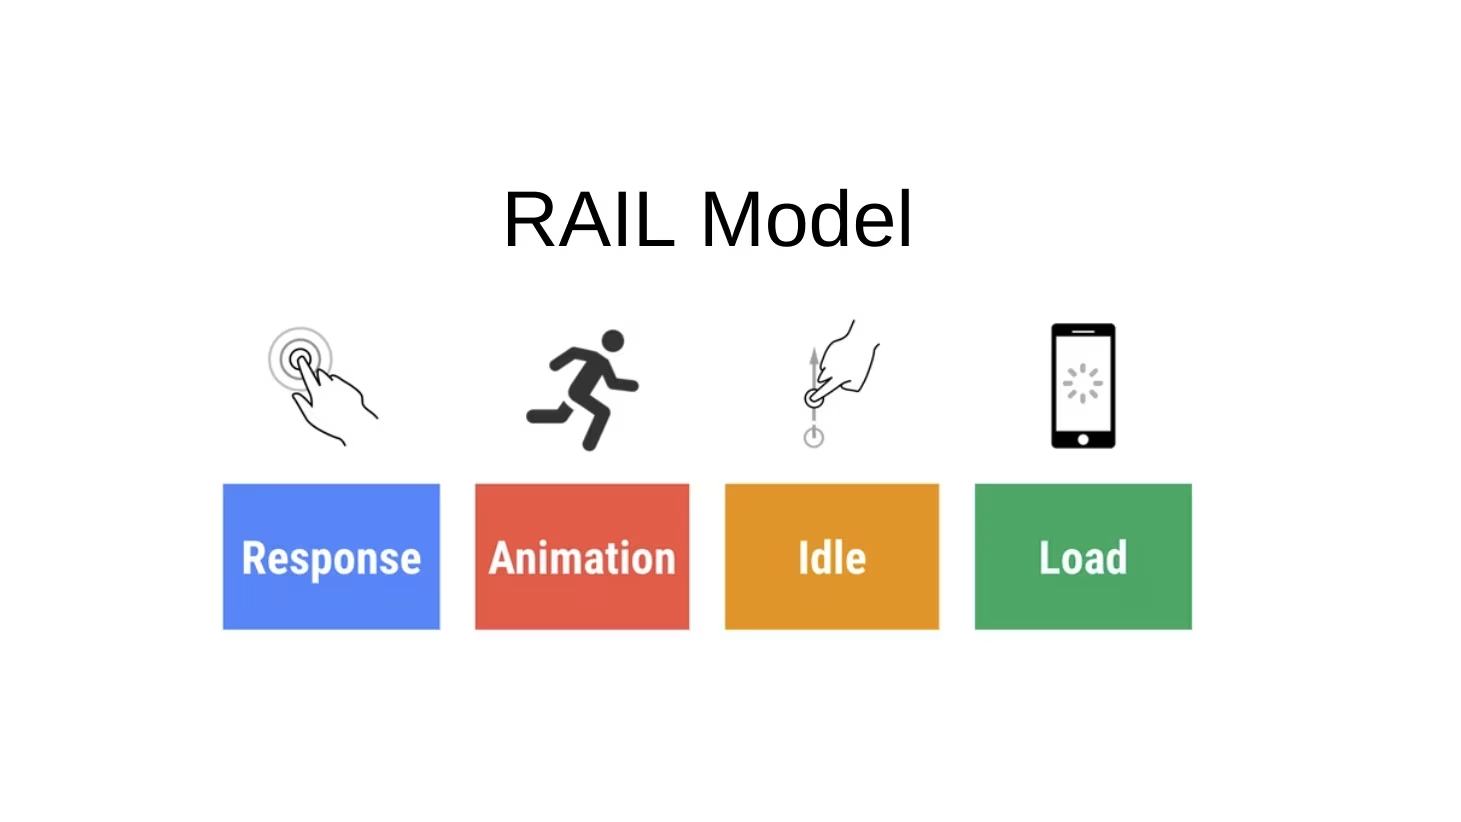
Understand the RAIL-model
- Get to know the underlying model behind modern performance metrics
Tooling
How to read, record and analyze flame charts
Performance Tab
Performance Insights Tab
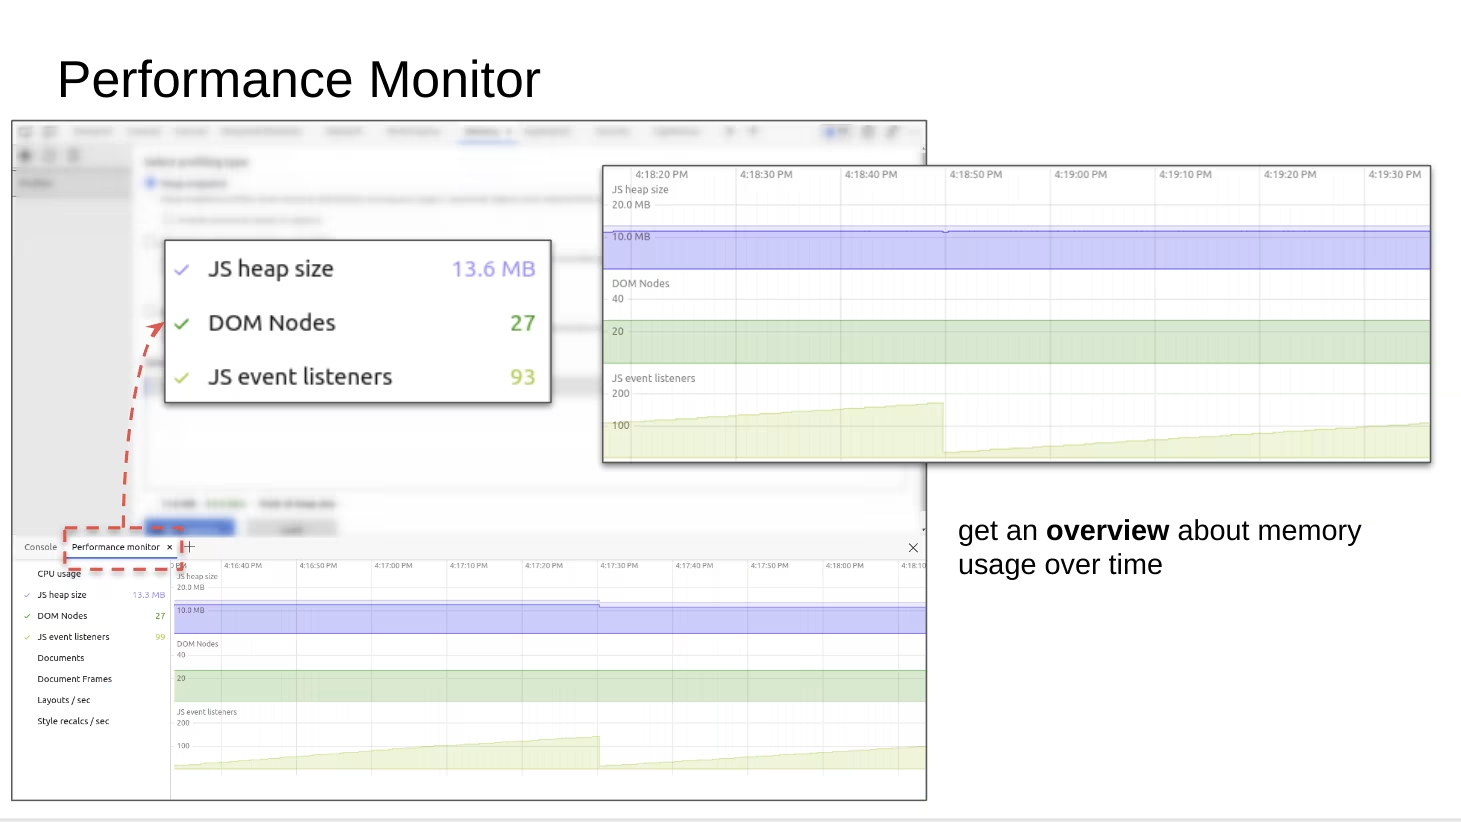
Performance Monitor
Network Tab
Chrome & MS Edge DevTools
Lighthouse
Userflow
Memlab
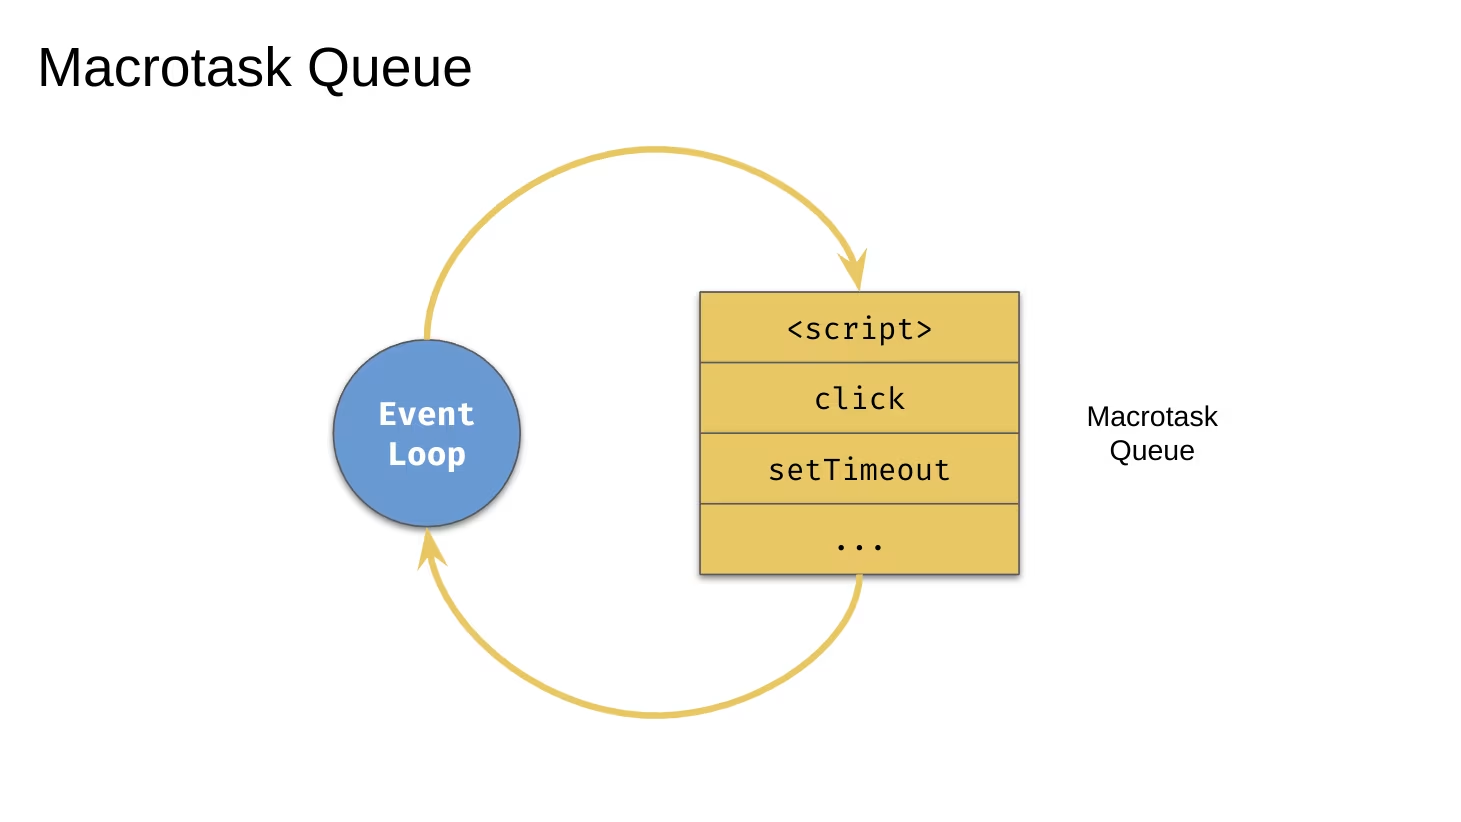
The JavaScript event loop
Understand how the JavaScript vm executes code
Learn the difference between macrotasks & microtasks
Gain in-depth knowledge about scheduling techniques
Control the event loop by prioritizing work
Master the single thread - main thread scheduling
Optimization Techniques
Leveraging browser native features for better performance
Project Aurora
Resource hints
Priority hints
ResizeObserver & IntersectionObserver
CSS and DOM performance best practices
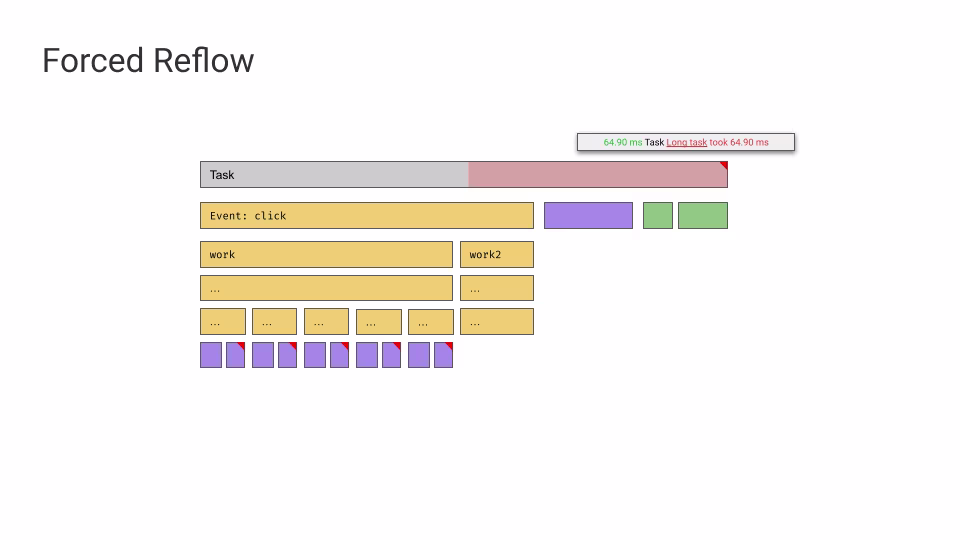
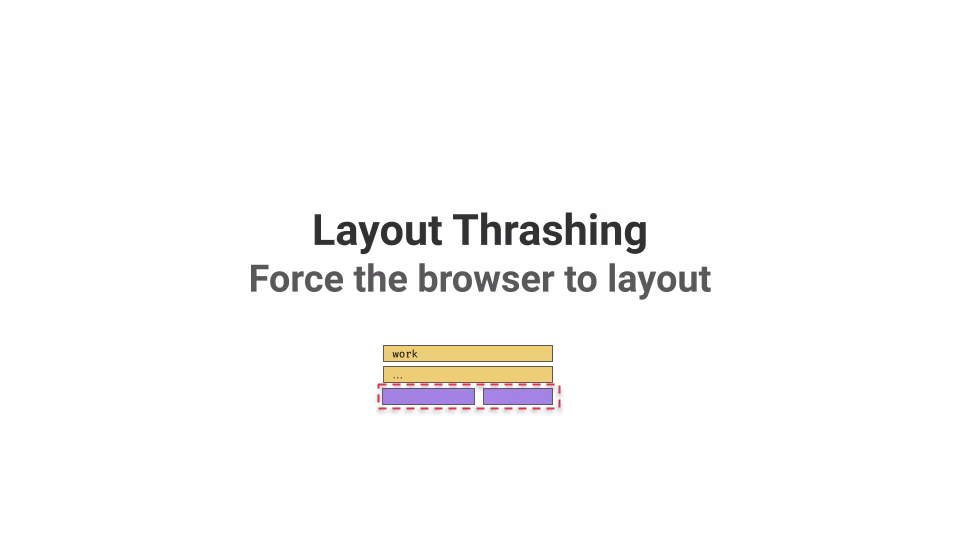
Forced reflow, layout thrashing
CSS containment & content visibility
Next generation CSS features
ResizeObserver & IntersectionObserver
JavaScript Memory Analysis
Understand how JavaScript applications consume memory
How to inspect the memory heap
How identify memory leaks
Strategic approaches how to fix memory leaks
Ship less and more efficient
Network analysis and improvement strategies
Bundle size analysis & shipping as less code as possible
Resource hints
Priority hints
JavaScript & TypeScript language best practices
Choose the right data structure
Looping performance
Auditing, monitoring & measurement
How to conduct a performance audit?
What and how to measure?
Performance code review checklist
Preview of the workshop


Meet the trainers

Christopher Holder
 Performance Expert
 Trainer

Julian Jandl
- Performance Expert
- Trainer
 Nx Champion

Michael Hladky
 Google Developer Expert
 Microsoft MVP
 Auth0
Auth0- Trainer
- Nx Champion

Enea Jahollari
- Google Developer Expert
- Performance Expert
 Architecture Expert
- Trainer