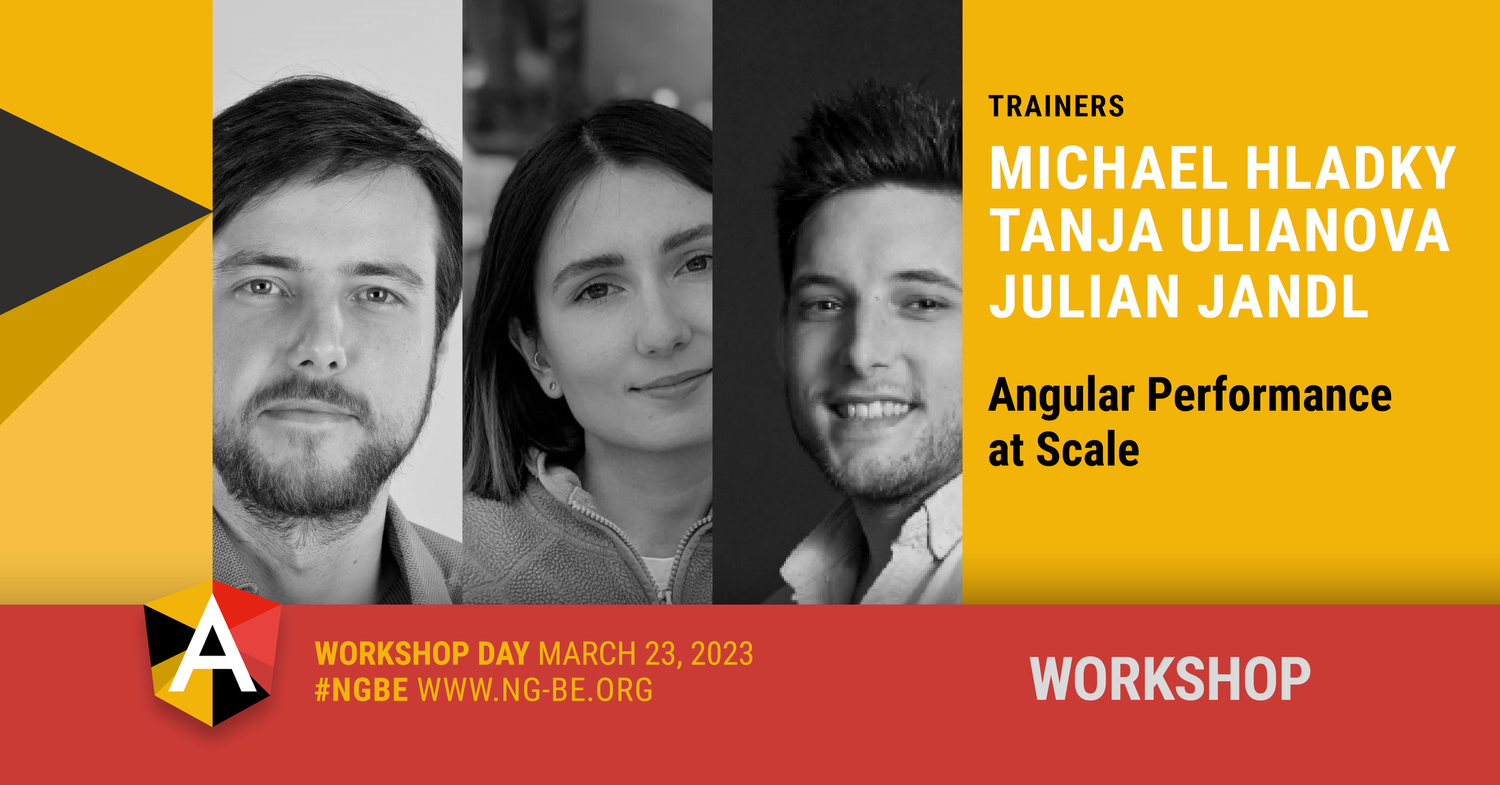
Angular Performance at Scale
About the event
In this workshop, Michael, Tanja and Julian share a large variety of tactics on how to debug, analyze and fix performance issues so you can make any Angular application perform at scale. Together we will take a closer look at how to conduct an application performance audit. Then, in a series of small presentations & exercises, we will introduce both fundamental and advanced knowledge in the field of change detection and other performance-related topics. In wrapping up, the trainers will review and analyze parts of your application for you to get valuable feedback on your specific implementations.
Meet the trainers

Michael Hladky
 Google Developer Expert
 Microsoft MVP
 Auth0
Auth0 Trainer
 Nx Champion

Julian Jandl
 Performance Expert
- Trainer
- Nx Champion

Tanja Ulianova
Tanja is a software engineer with a passion for solid software architecture and smooth user experience. She loves learning and sharing knowledge. Since 2017 she is trying to make the web a more inclusive space by advocating for web a11y.
- Performance Expert
- Trainer