Advanced workshop
Architecting Angular Apps for High Performance
High-Speed Angular applications on any device
Learn more
Zone can and sometimes should be manually configured, especially when customizing change detection in Angular applications for performance reasons. One of the available approaches is to do it over zone flags. Allowing you to fine-tune your Zone, zone-flags
Running into issues, even those that are hard to debug, does not mean you should go back to the default change detection configuration. Instead, let’s uncover the most common scenarios, in which zone-flags
If you are looking to learn more about Angular’s change detection mechanism, please refer to the following article: Introduction to Change Detection.
Advanced workshop
High-Speed Angular applications on any device
Learn moreZone flags allow configuring zone.js globally, which is generally a good thing, even though not without certain risks.
1. Global vs. local config. Applications that rely on global state management are by nature push-based, meaning that changes are propagated in the state once they occur. This push-based reactivity puts such apps in a good position by eliminating the need for dirty marking as such. However, at the same time, it is also possible to implement specific local state management and thus fix possible bugs quite easily for most of the flags.
💡 Pro Tip:
Local state reduces the possible debugging scope by limiting it to specific feature or UI components.
2. Third-party libraries. Another risk is that statically configured zone flags may affect third-party libraries that rely on the zone-flagged APIs to detect changes. Although this is evidently a pitfall one should be aware of when configuring zone-flags
Chances are nothing will break if you turn off some of your flags. You will start noticing major regressions in the UI only when most of the flags are disabled. That’s just how zone-flags
💡 Pro Tip:
After you disable a zone flag, go and check both the application and its codebase to ensure your change detection is still triggered as intended.
3. Monkey patching. At that, I’d like to stress one more challenge with zone-flags
In the following sections, I suggest taking a closer look at the most effective debugging strategies that will help to get the most out of configuring Zone while eliminating most of the issues associated with it.
All the above risks considered, I suggest taking an incremental approach to configuring Zone over zone flags. The following checklist will help you ensure, step-by-step, that your migration is seamless and safe.
1) Make sure ChangeDetectionStrategy.OnPush
2) Prioritize flags based on the criteria like the location and frequency of their usage or the resulting issues’ complexity.
3) Pick one easy-to-control API you want to flag. Of course, the safest way is to work with one API at a time. And if you want to secure your app from breaking, your surest bet will be to go with these flags:
HTTP requests (XHR flags.) The HTTP layer needs to be encapsulated and not used in components, which makes it easy to flag.
setTimeout and setInterval (timer flags.) They all are easy to find in a codebase, measure impact, and check for breakages.
Mouse/input/keyboard events. Every mouse event has an explicit handler in the code.
requestAnimationFrame. There are very few of those in the codebase, so it will be easier to keep track of them.
4) Examine the application codebase for the APIs being used to find the spots where it may break.
5) Identify third-party libraries that employ the flagged API as there is a risk of them breaking.
6) Switch on the zone flag in question.
7) Take flame chart measurements or use breakpoints to ensure they are working. Later in the article, we will take time to figure out how to use breakpoints for debugging purposes.
8) Test your application to see if everything works fine.
On top of the discussed migration best practices, there are also several approaches to debugging the zone.js behavior. Namely, it can be fixed over:
The browser console
The DevTools performance tab
Breakpoints
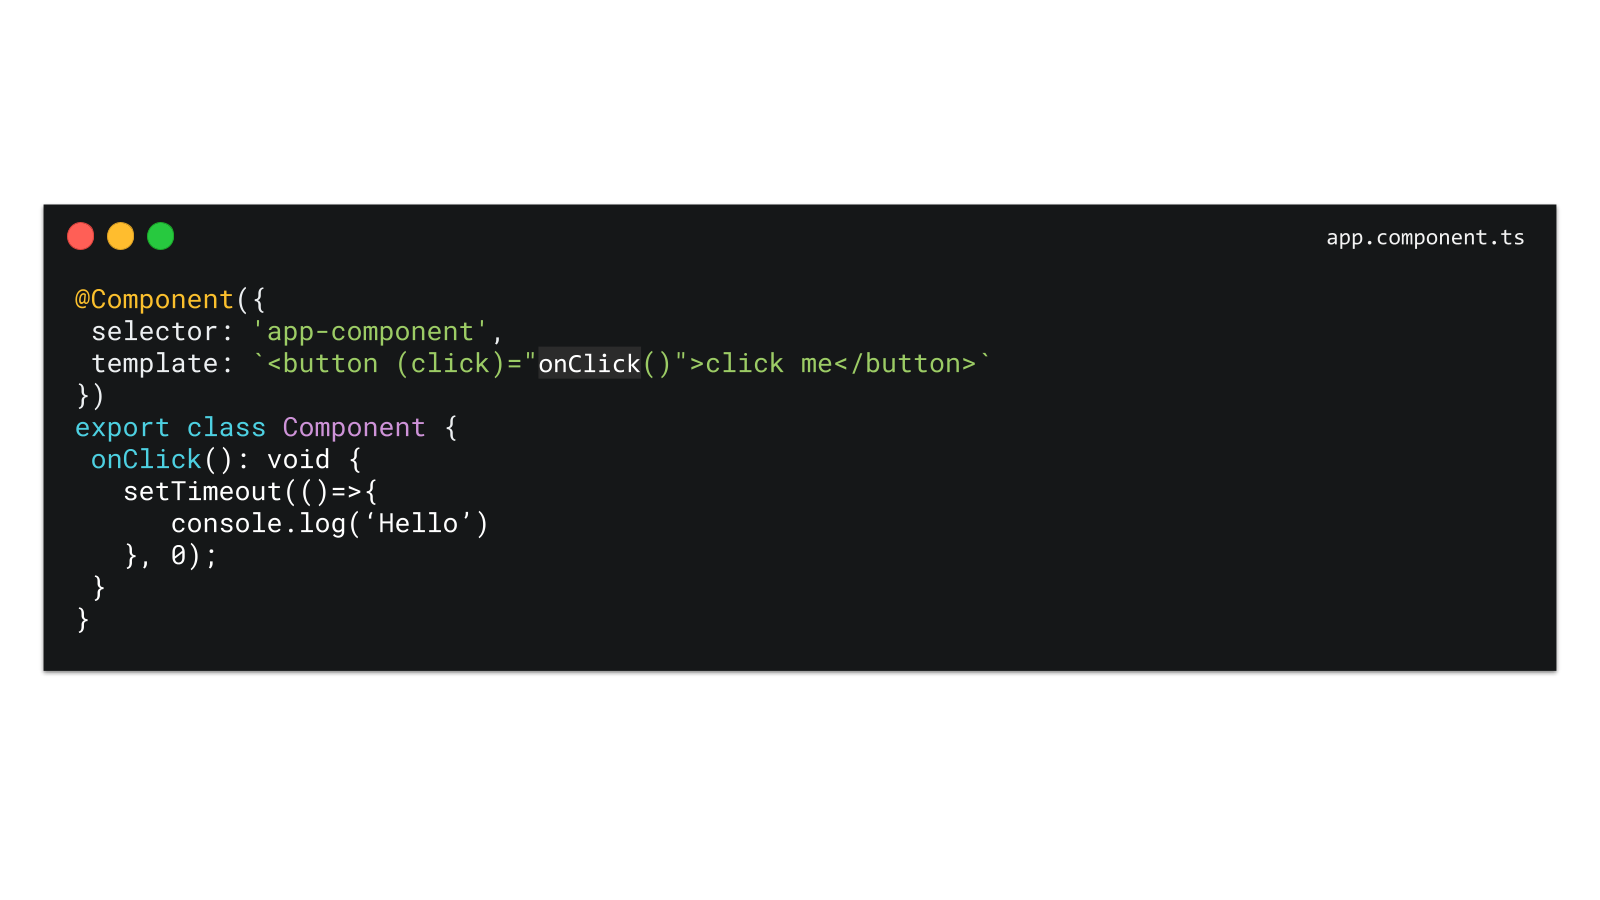
But before we go into detail about how each of these options works in real life, please consider the minimum setup we will need to ensure to go on with debugging. First, we have to add this code into the app.component.ts file:
@Component({
  selector: 'app-component',
  template: 'click me',
})
export class Component {
  onClick(): void {
    setTimeout(() => {
      console.log(‘Hello’)
    }, 0);
  }
}
Then, in polyfills.ts, we need to include the following imports:
import './zone-flags';
import 'zone.js/dist/zone';
The zone flag we will use in our example is the timers
window.__Zone_disable_timers = true;
⚠️ Notice:
Zone.js not only monkey patches existing APIs but also can add additional properties to the
object, which is represented by globalThisin a browser. While doing so, zone.js maintains both the flags we set on the windowobject and unpatched APIs over globalThis. globalThis
Now that everything is set up, let’s discuss each of our debugging techniques one by one.
The browser console can log all sorts of front-end activities associated with a specific web page, thus proving instrumental in detecting errors, warnings, and bugs. Working with the console, one can unlock truly advanced logging and debugging capabilities and access vital information varying from network requests and responses to security warnings to complete details on specific DOM elements.
In particular, all these features make the browser console a perfect tool for debugging zone.js. With this in mind, let’s consider an example of troubleshooting and resolving patching issues using the browser console.
For the sake of example, let’s consider what happens before and after timer APIs are patched and how the console can come in handy at these two stages.
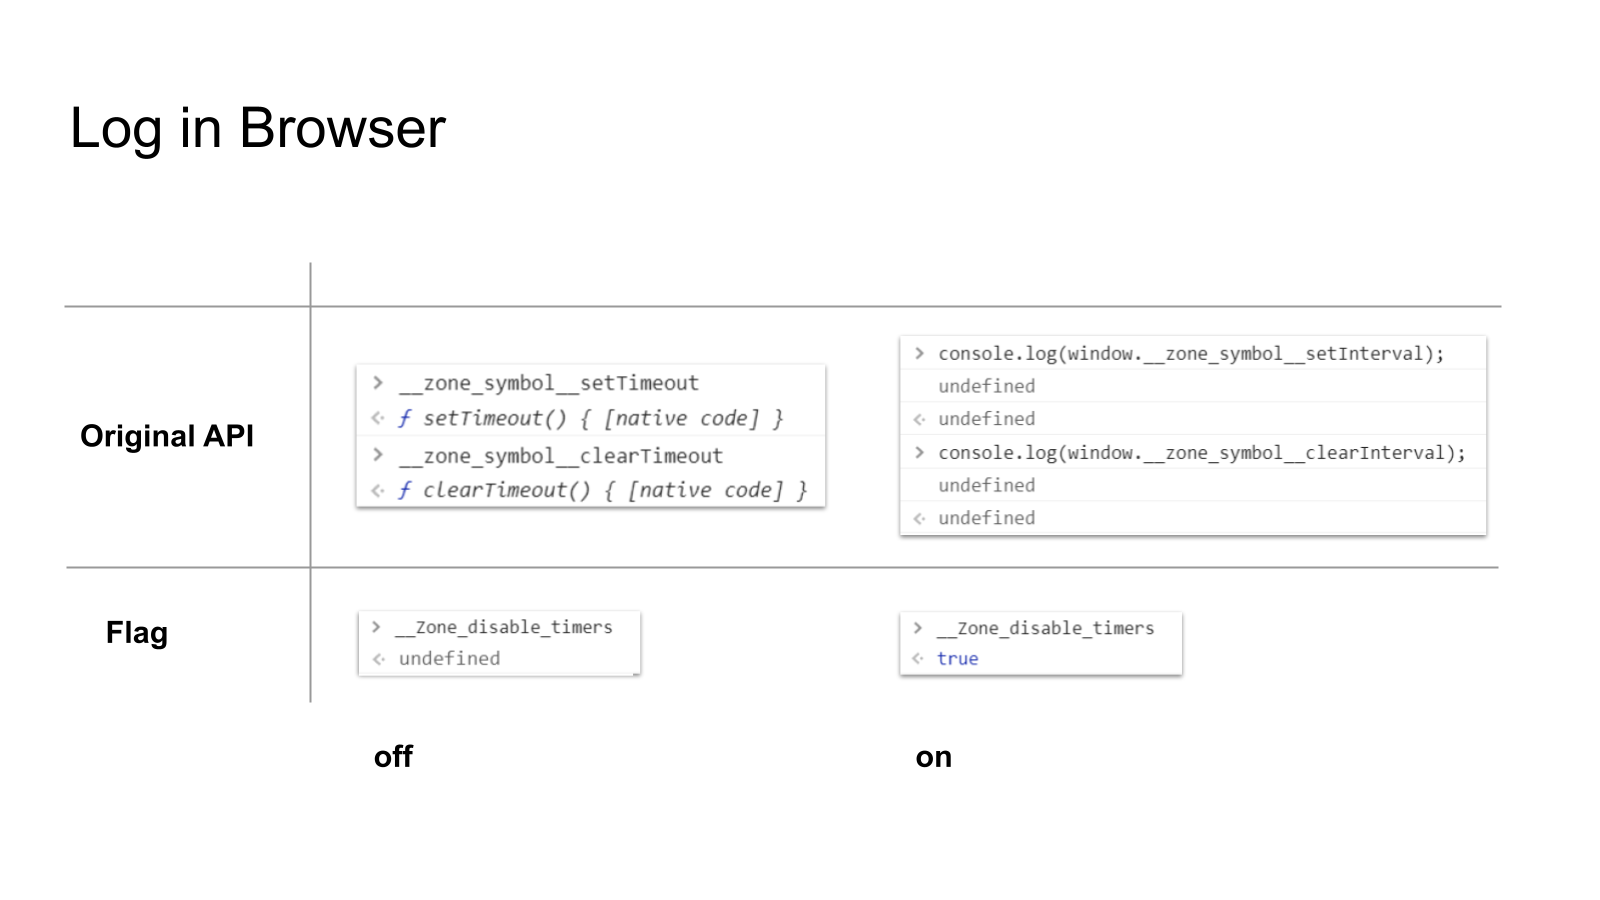
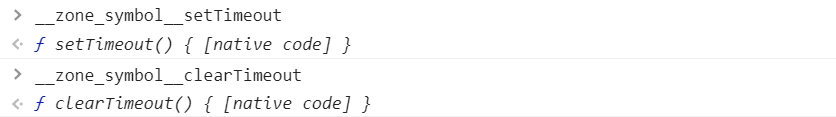
But first I’d like to stress that, generally speaking, to figure out whether our zone flag is enabled or not, we can log it in the browser. If Zone is patching the API, it will always restore the original API under global variables (here: __zone_symbol__setTimeout__zone_symbol__clearTimeout
Now, let’s walk through the two states in a bit more detail.
First off, you can check if the flag is disabled by accessing the window object directly and getting the logging information displayed on the console:
// logs 'undefined' if the flag is active
console.log(window.__Zone_disable_timers);

Another thing you can check using the browser console is whether or not Zone has actually patched the respective API. To this end, you should search for the original version of the API, which is supposed to be stored at the globalThis
// logs the unpatched/original setTimeout API if zone was active
console.log(window.__zone_symbol__setTimeout);
console.log(window.__zone_symbol__clearTimeout);
This is the result you will get if you try to access the logging information before timer APIs are patched:
Correspondingly, we will get the opposite results if we run the above two checks after using a zone flag for timers.
Now, if we try to verify whether the flag is set, the function should return true:
// logs 'true' if the flag is active
console.log(window.__Zone_disable_timers);
And if we run the second check after APIs are patched, we should get the logs of the original unpatched setTimeout API:
// logs 'undefined' if zone was not active
console.log(window.__zone_symbol__setTimeout);
console.log(window.__zone_symbol__clearTimeout);
Here is the output you will see if APIs are unpatched:

💡 Pro Tip:
RxAngular offers more convenient ways to configure and debug Zone-Flags. First, add the following content into
: zone-flags.ts
import { zoneConfig } from '@rx-angular/cdk';
zoneConfig.global.disable.timers();
After zoneConfig is imported, check zone-flags with RxAngular debug helper
in the browser console: window.__rxa_zone_config__log()
window.__rxa_zone_config__log(); // logs all active flags
Chrome DevTools are known for their comprehensive performance tuning and debugging features. This is why, in our examples, we will be using the DevTools’ performance tab to address such issues:
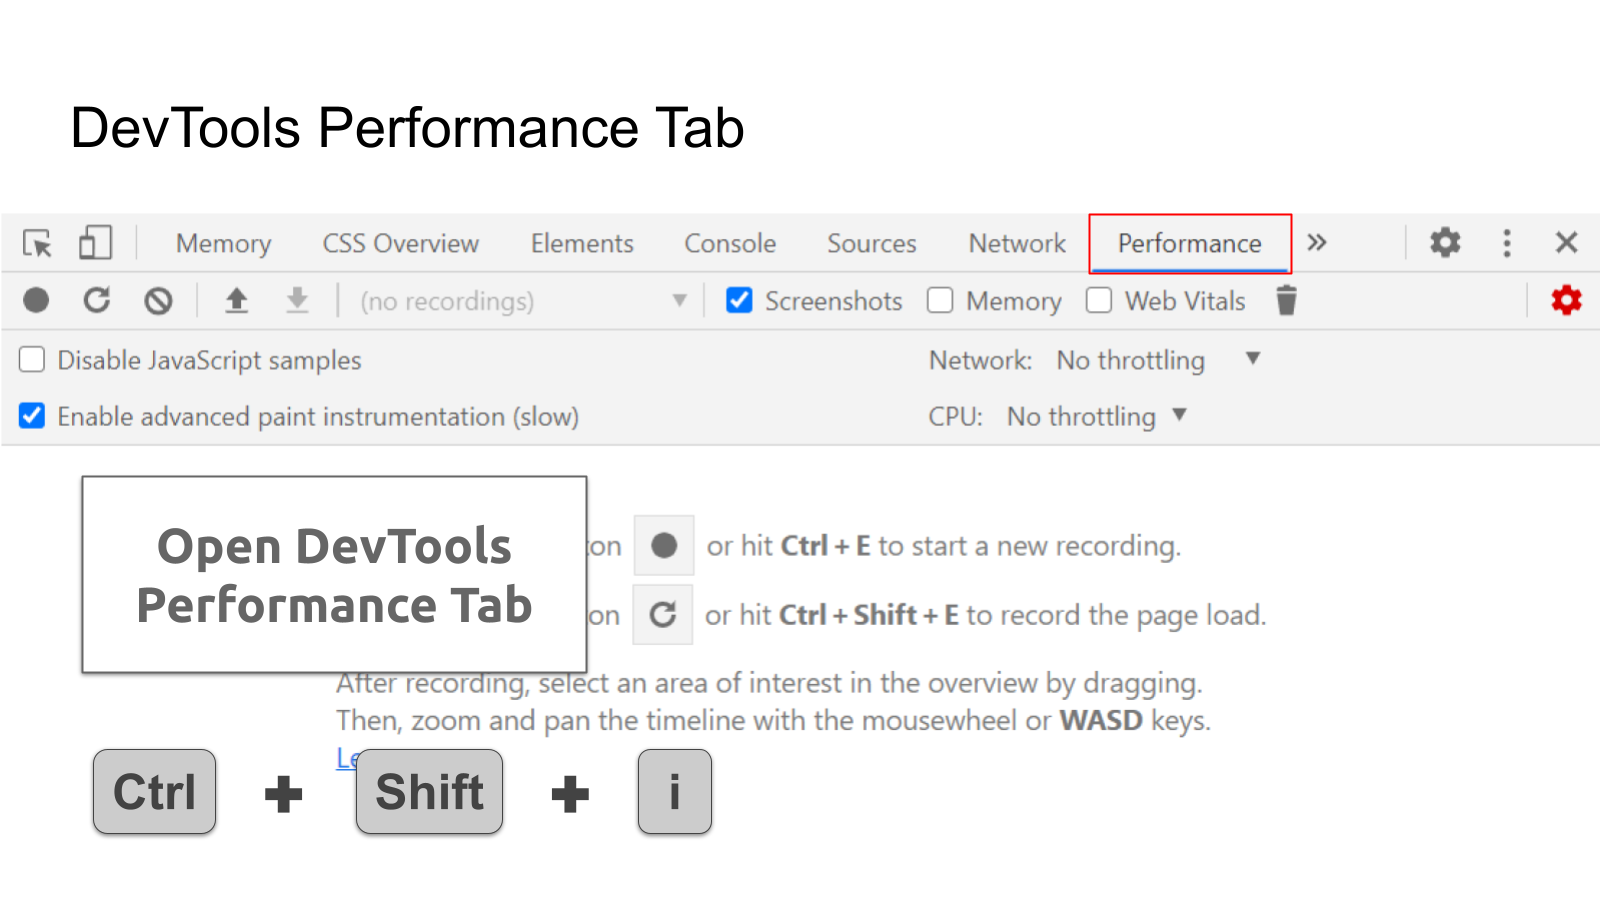
Also, we will be referring to Flame Charts, for they can show us the state of the JavaScript code that is being executed. This transparency of the data visualized in the flame charts not only allows for easier debugging of our zone-flags
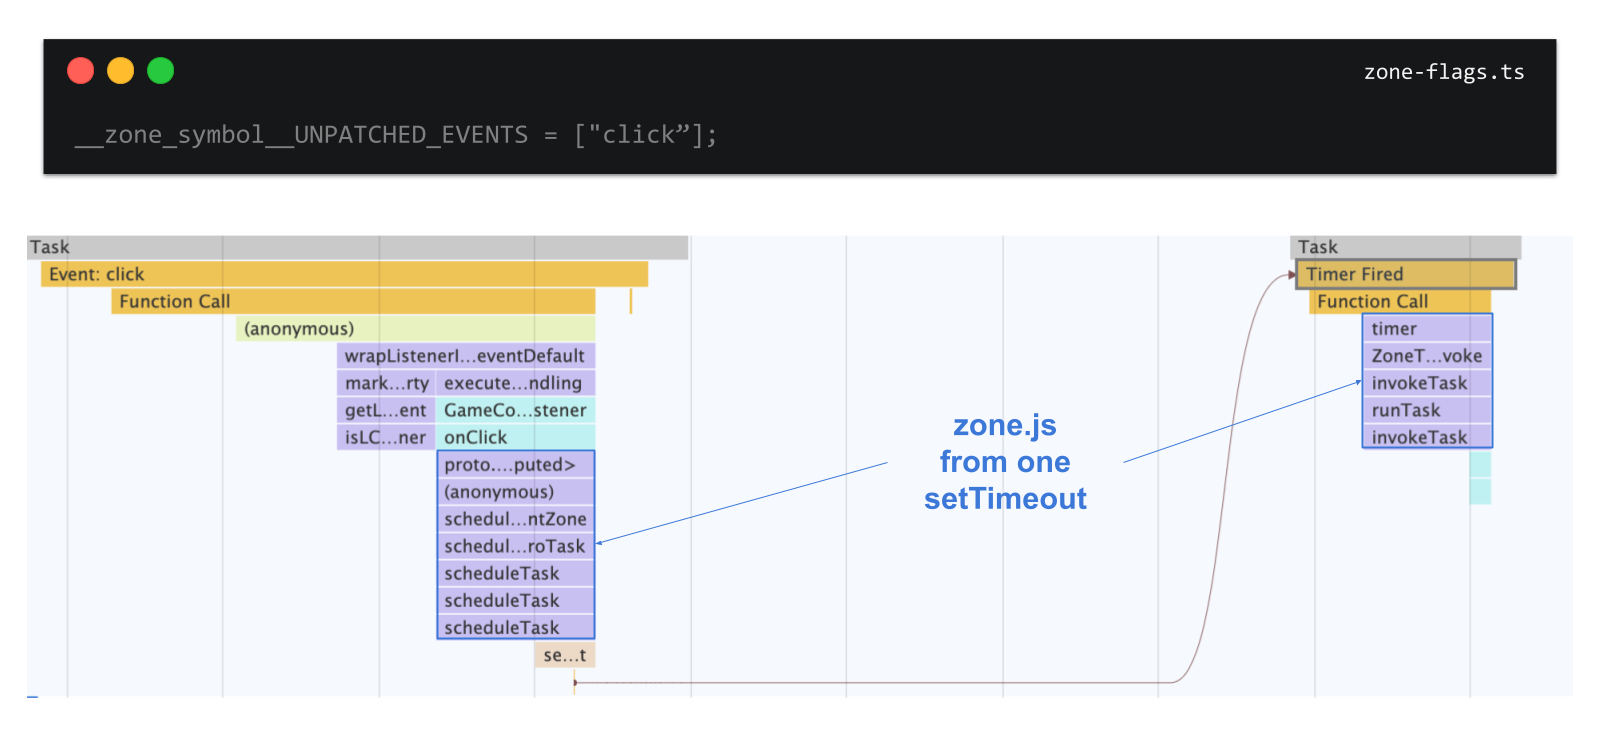
The following example shows how the flame charts for patched and unpatched timer APIs differ.
By default, zone.js monkey patches timer APIs via methods like setTimeout()setTimeout()
Consequently, in the recording of a flame chart below, you can see a whole bunch of scheduled tasks piling up from a single setTimeout.

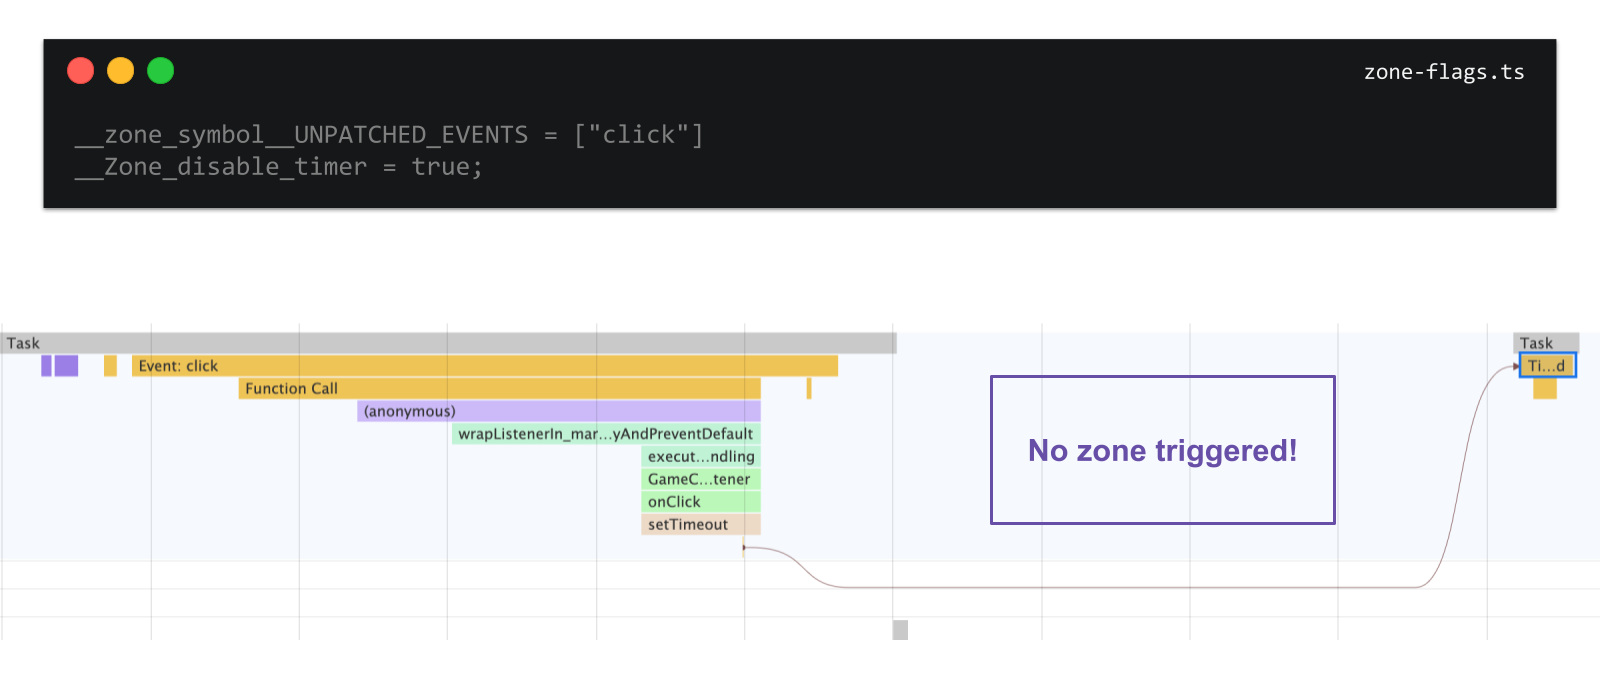
Alternatively, if you set __Zone_disable_timertrue

__zone_symbol__UNPATCHED_EVENTS = ['click'];
__Zone_disable_timer = true;
💡 Pro Tip:
Recordings should capture fully identical interactions with flags on/off to ensure a valid comparison. By fully identical, we should understand that even the mouse moves and time to wait in between the interactions are crucial. Keeping everything exactly the same will make finding the right spot in flames easy and fast.
You can use this tool to compare two charts by dragging and dropping the profile measurements into the UI. Also, remember to download a report once it’s ready as a JSON file.
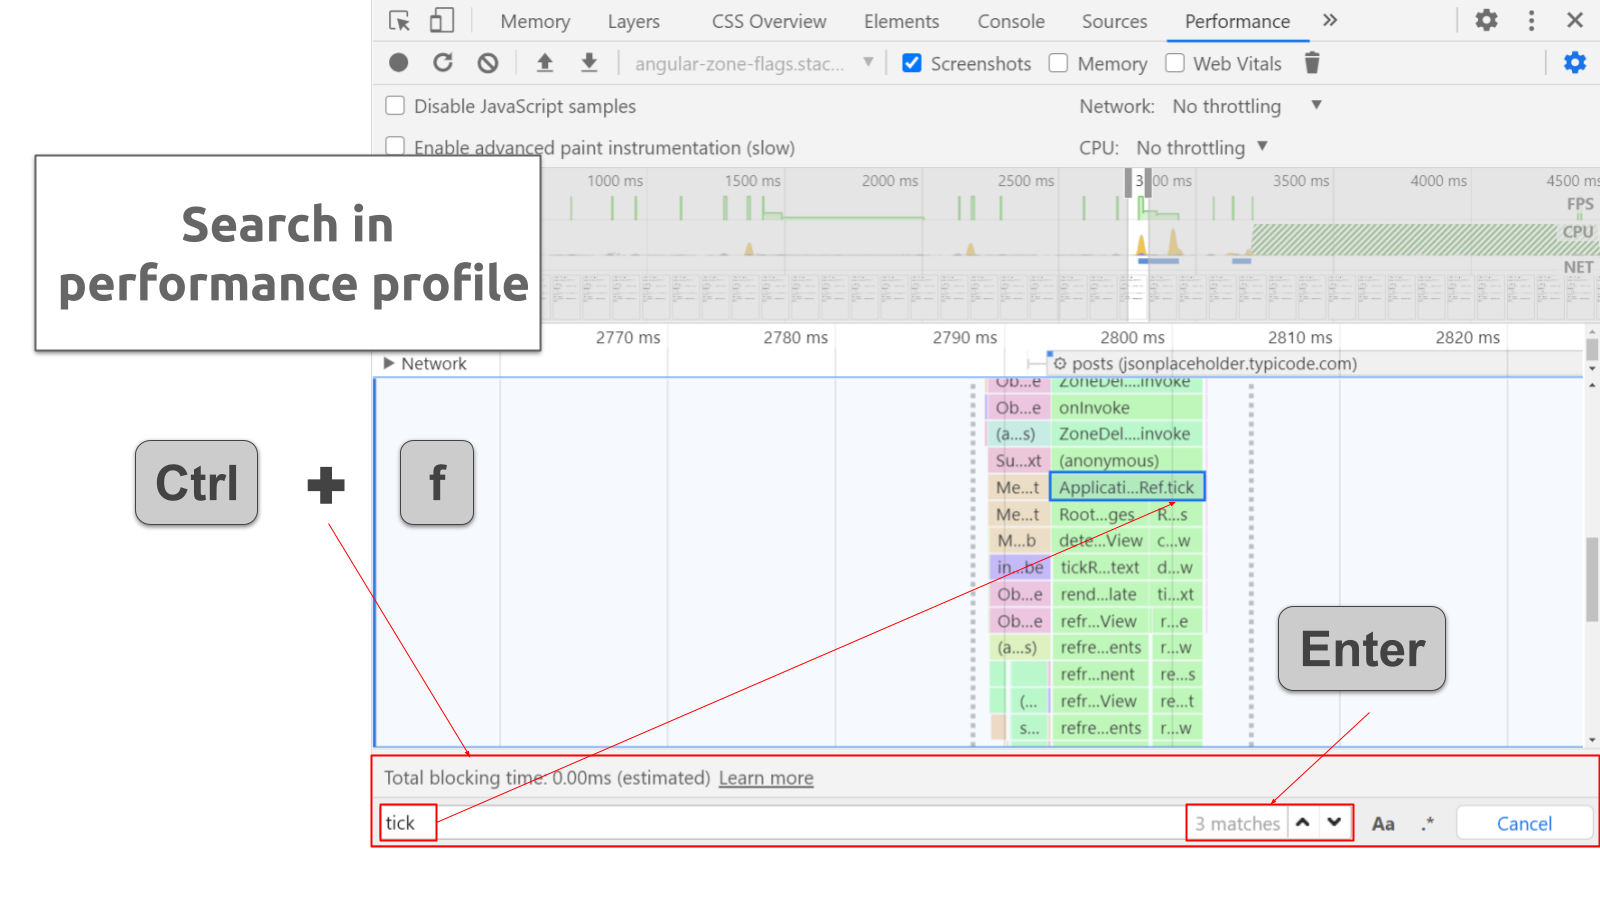
Every .js file has its own different color on the chart, which is assigned randomly except for native browser calls – they are yellow. It means that your report can be filtered according to your individual needs. So, for example, to see who invoked Timer (a long curve on the flame chart), tick the corresponding checkbox in extended preferences:

Then, search for 'tick' – it indicates that ApplicationRef#tick
⚠️ Notice:
Some events may be caused by your browser extensions. To avoid that, open the tab in incognito mode.
Zone.js patching mechanism is also visible in the flame charts’ timing line. You can find the timing marks before the bootstrap phase of Angular.
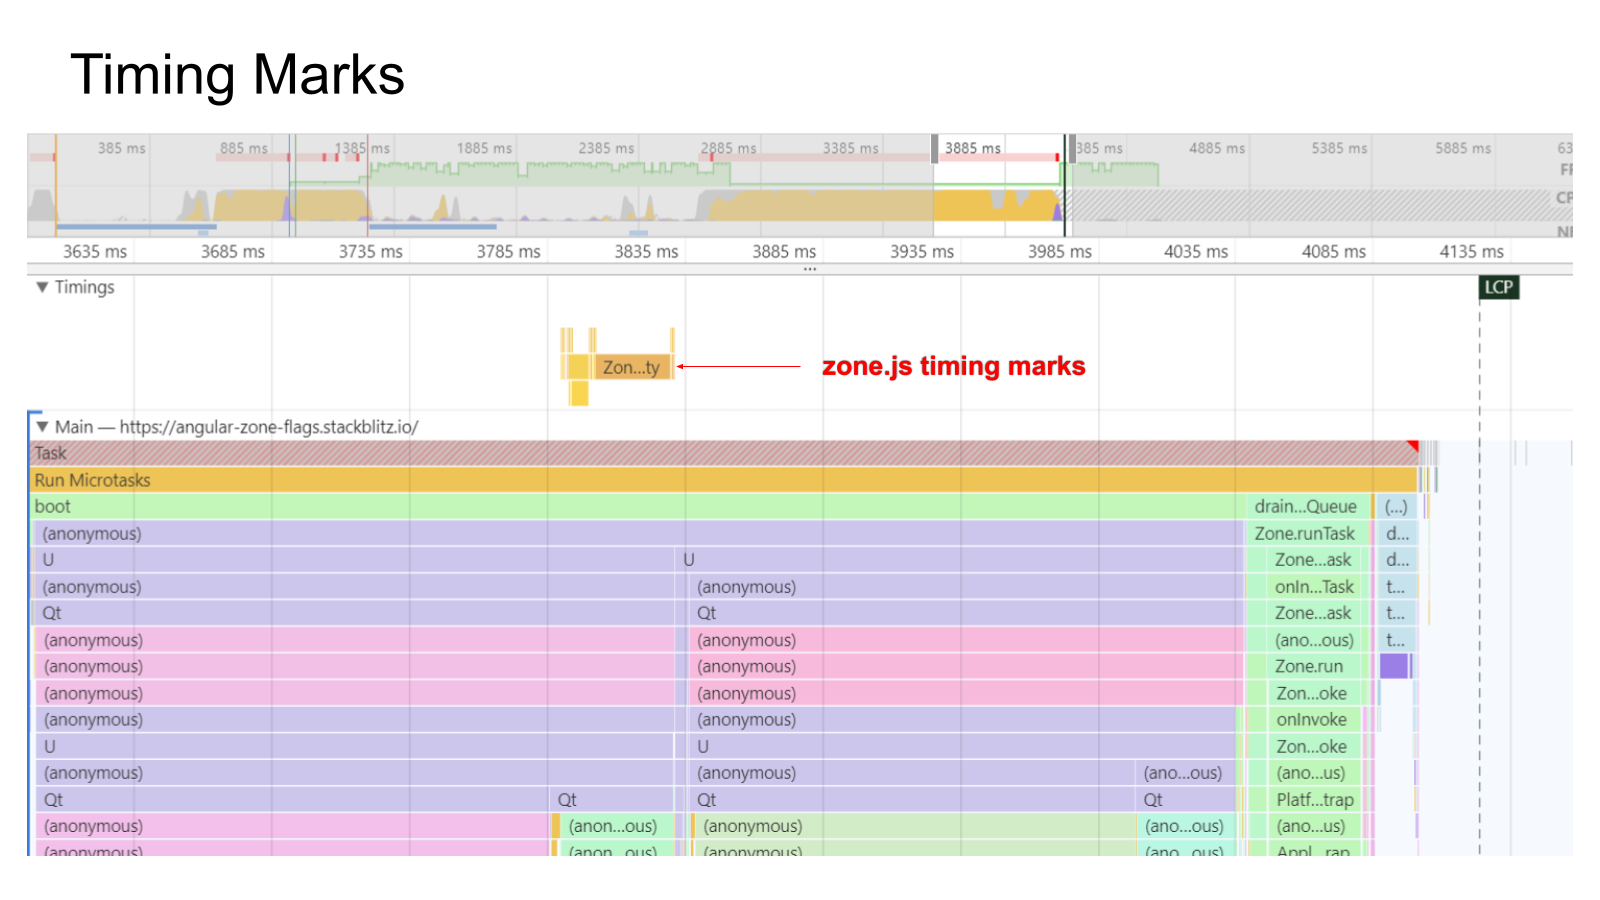
Every patched API is listed there as well.

💡 Pro Tip:
Unpatched APIs should not show up in the timing line. This can serve as another check. If you can't see the timings panel, check out this link.
Breakpoints should be one of the main debugging techniques in your toolbox in general and especially when configuring zone-flags. You can set a breakpoint on any line of executable code to pause the code execution there and inspect your program’s current state.
Below, you can see Zone Patches listed in a flame chart:

In order to use breakpoints for debugging purposes here, you should navigate to zone.js code and check if the patch is invoked.
As you can see, there are quite a number of measures and precautions that you can take to ensure your zone flags’ successful configuration. Thus, taking into account all the possible risks and having the right debugging strategies in place – in particular, those using the browser console, DevTools performance tab, Flame Charts, and breakpoints – you can prevent the issues that might occur when configuring zone.js or debug your code when it doesn’t work properly.
If you wonder how Zone Flags work in RxAngular, feel free to check out the previous article: A Close Look at Zone Flags in RxAngular.
Intermediate workshop
Master Nx to enforce architecture, speed up your development workflow and improve code quality
Learn more
Currently, there are two ways of configuring zone.js. In the previous article, we’ve discussed how to disable Zone completely over BootstrapOptions. Zone Flags is the other equally viable alternative to consider when deciding to configure zone.js.


PushBased's 2024 recap: 43 talks, NgGlühwein conference, RxAngular updates, and more. A year of growth, innovation, and community! Read our journey. 🚀

While it is quite well documented how to disable a zone completely, there is no information out there about fine-grained adoptions. Zone-Flags can come in handy when taking this approach and substantially improve the performance of your Angular app.

In this article we're taking a deep dive into optimizing Interaction to Next Paint (INP) with scheduling APIs. We will examine native solutions with their pros & cons and RxAngular's approach to performance optimizations.


The RxAngular team & community shipped great new features as well as quality of life improvements with the latest releases. In this blog post we'll dive into RxAngulars recently added new features, including the native support for signals.


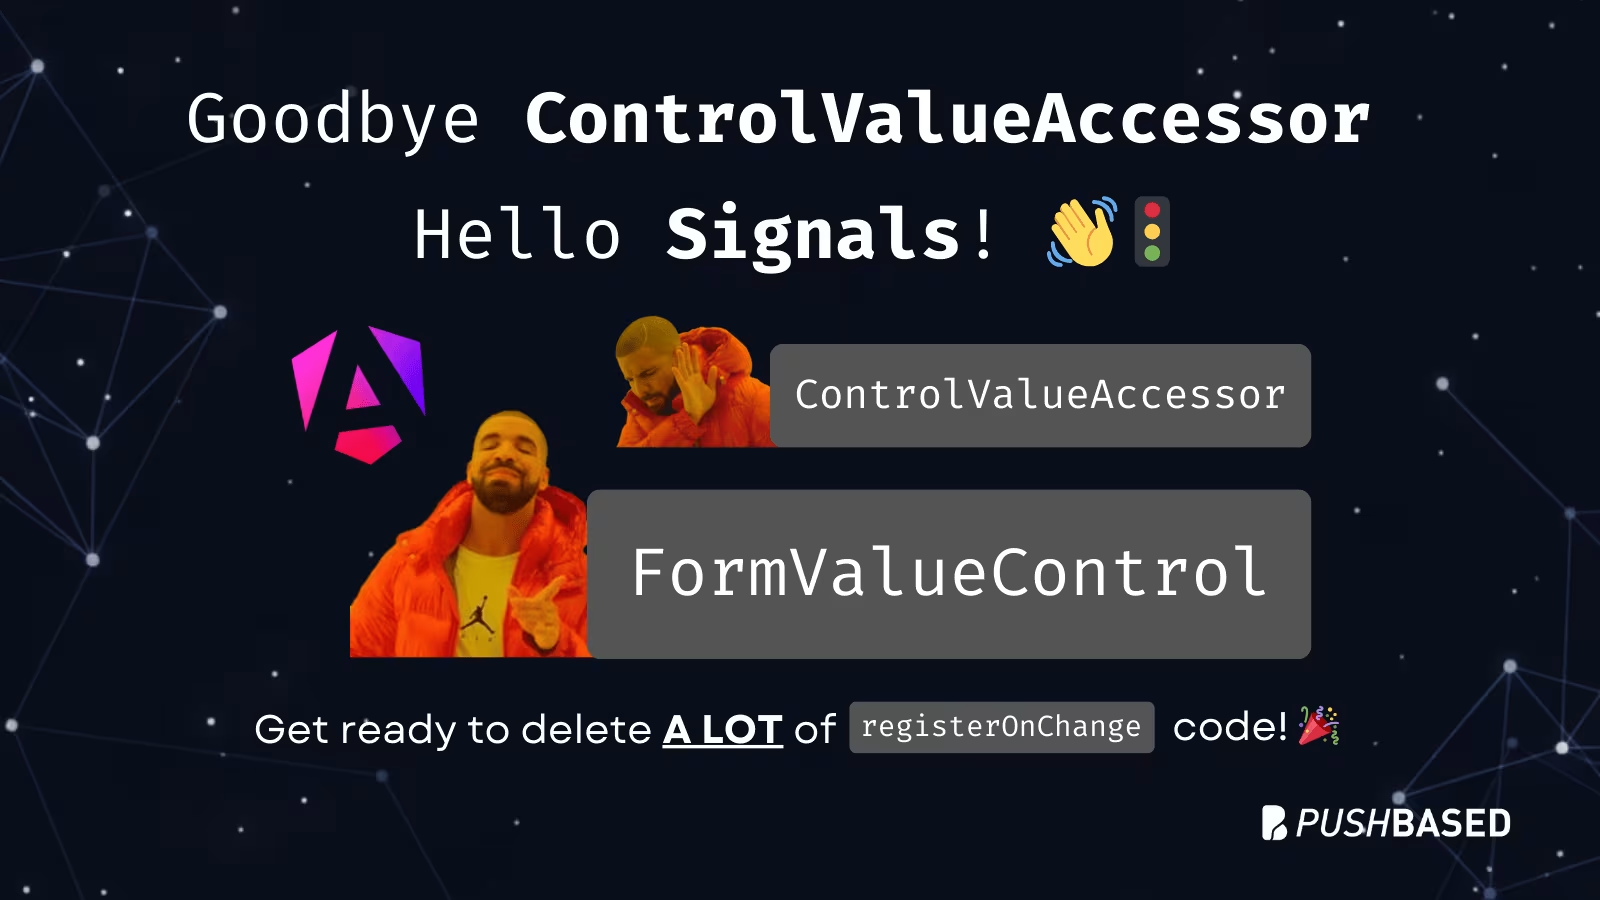
Angular is bridging the gap between the new Signal-Forms architecture and the Template/Reactive Forms. This isn't just a minor update—it’s a fundamental shift in how we author custom form controls.