
Table of Contents

Intro
In today's competitive business world, performance audits play a big role in learning and continuous improving UX. As I had quite some time with performance auditing, I learned invaluable lessons from both successes and missteps, how to estimate and apply my findings. Auditing is a creative process with unexpected findings and learnings that makes the work on web performance so interesting and fulfilling. In a conventional audit document this is perspective is hidden completely. The following document is a unconventional mix of an audit document, tips to structure data and text as well as written thought processes, offering you a methodology. By including all of my miss assumptions and fails, it is a more natural way of learning then reading a conventional audit. I hope it helps you to see the creative process and fun behind web performance auditing! And maybe it encourages you to ensure good CWV, UX and energy efficiency for your company.
Michael Hladky
TL;DR
Comparison - Filmstrip

FP/LCP Hero Video /Idle
Measure | FP | LCP - Hero Video | Idle |
|---|---|---|---|
Before | 2300ms | 6800ms | 6800ms |
After | 2300ms | 2300ms | 4100ms |
Comparison - Flame charts
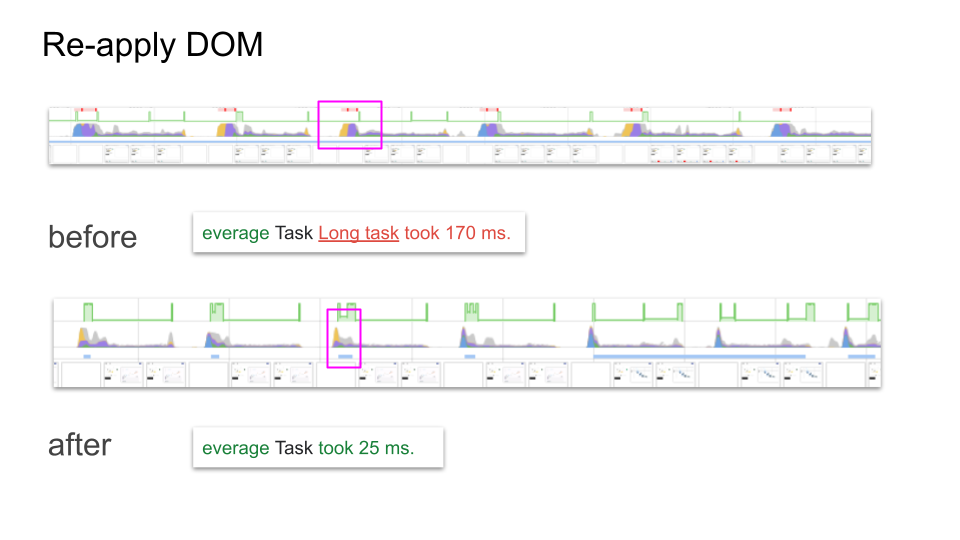
Re-apply DOM

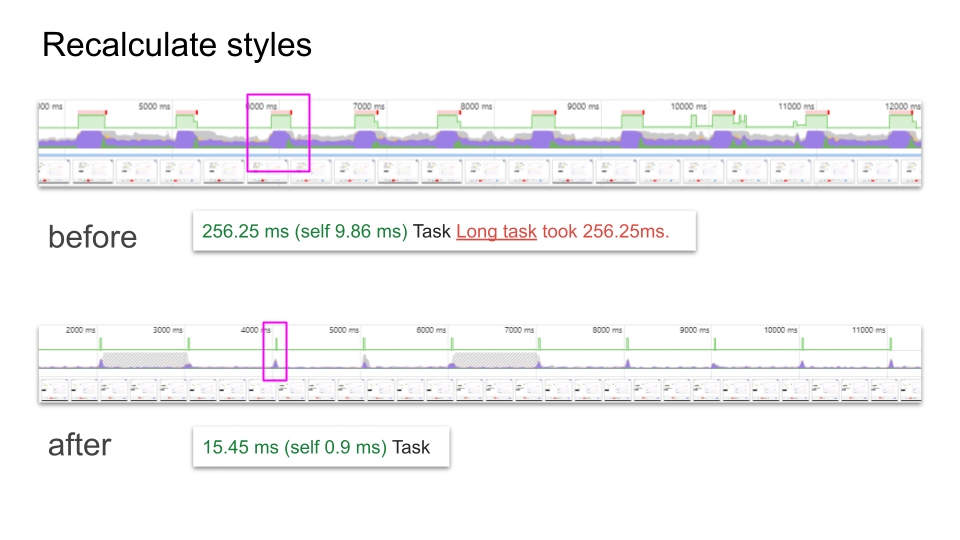
Recalculate styles
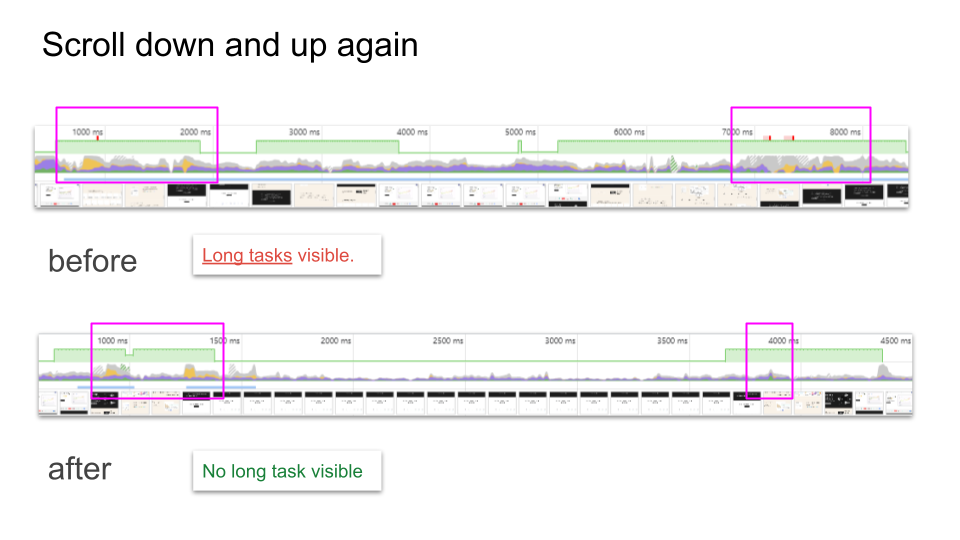
Scroll down and up again
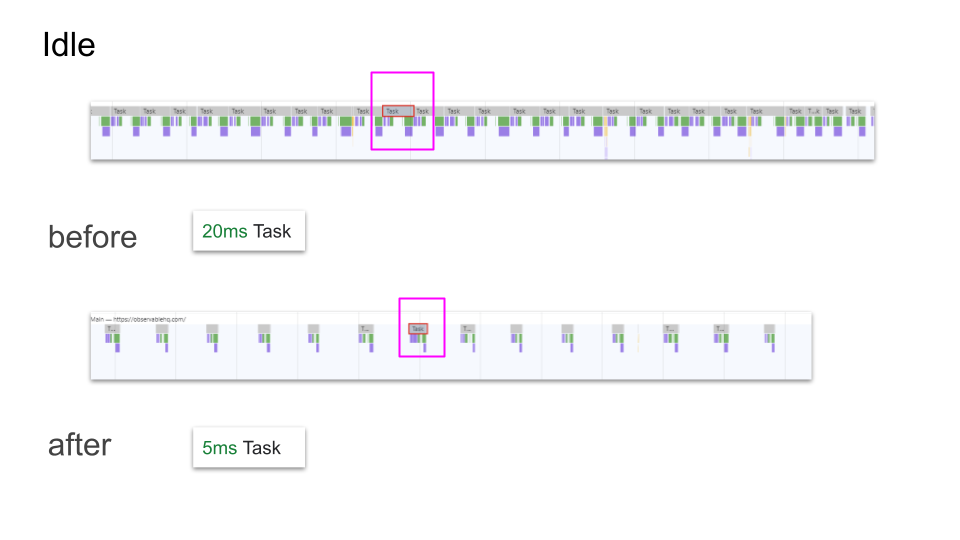
Idle

Average Improvements in milliseconds
Measure | Ø Task before | TTB before | Ø Task after | TTB after | Notes |
|---|---|---|---|---|---|
Re-apply DOM | 110ms / 160ms | 90ms / 110ms | 27ms / 21ms | 0ms | numbers apply to add DOM task/ recalculate styles task |
Recalculate styles | 230ms | 180ms | 18ms | 0ms | numbers apply to recalculate tasks |
Scroll down/up | 60ms | 11ms | 9ms | 0ms | taksk of bissy sections |
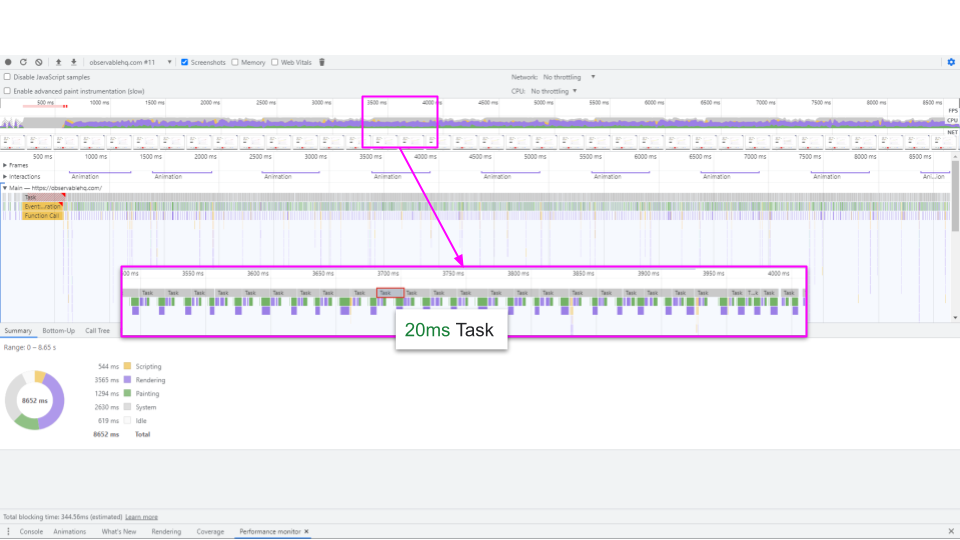
Idle | 20ms | 0ms | 4ms | 0ms | n/a |
Optimizations
Use the script in webpagetest or as DevTools snippet to reproduce the changes. To do so just copy the raw content from here.
Show me how to reproduce it quickly
To quickly check it in your browser open the DevTools "Sources" tab and click on "Snippets". Create a snippet with the code above, execute it and measure the impact.
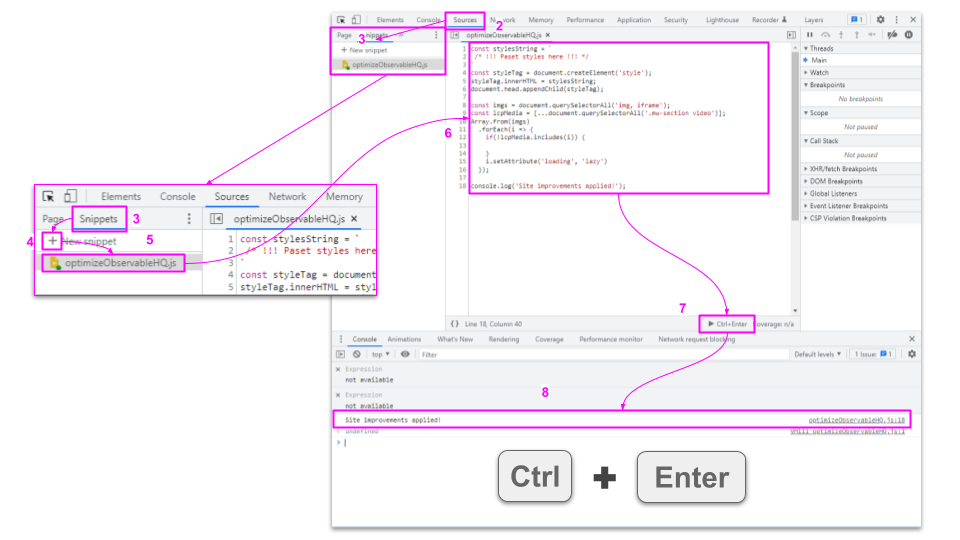
DevTools "Sources"
Open DevTools
Select Sources Tab
Select Snippets
Click New snippet
Give it a name
Insert scripts
Execute
Check console
webpagetest
Open webpagetest
Select "Site Performance" as test
Select "Advanced"
Paste the optimizations in the sectin "Inject Script"
Click on tab "Block"
Paste
annie-avatar.jpg ramona-avatar.jpgRun test
Check result
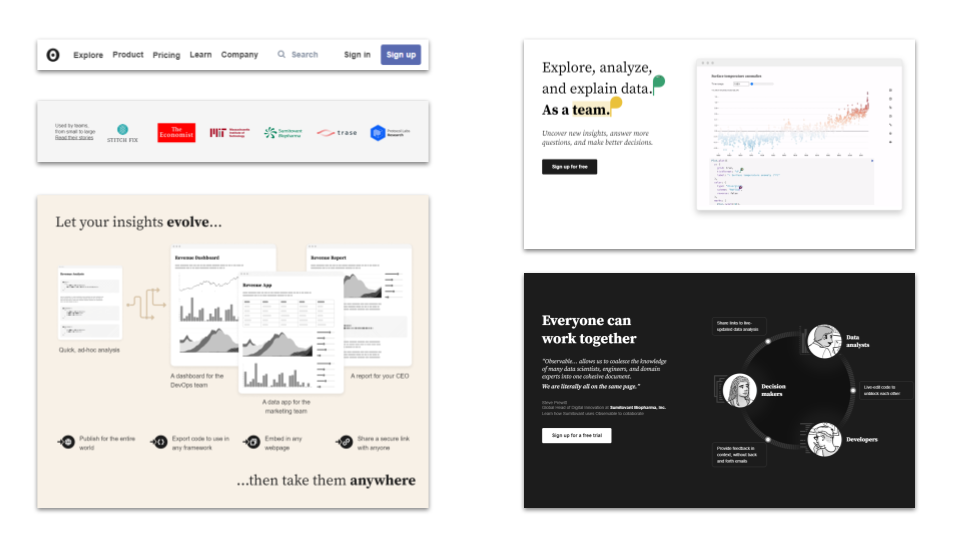
Main Page
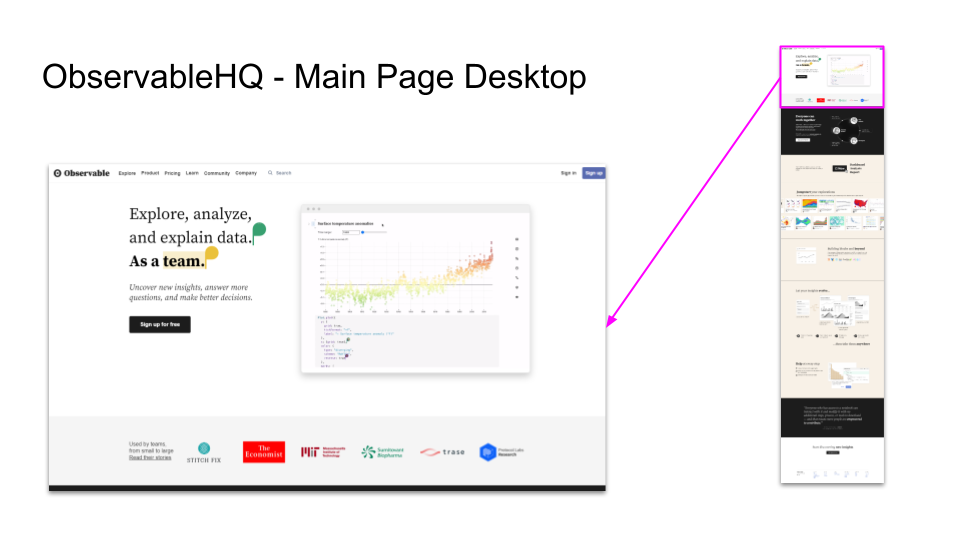
The pages, from the first glimpse, contain a lot of images and I guess live demos of the editor. It took quite a while to load the LCP video, but maybe it's because I sit in the kitchen instead of at my desk. 🙃 There, I always have bad connection. 💤
To get a good first overview let's start with the visible part in more detail.
Page Elements
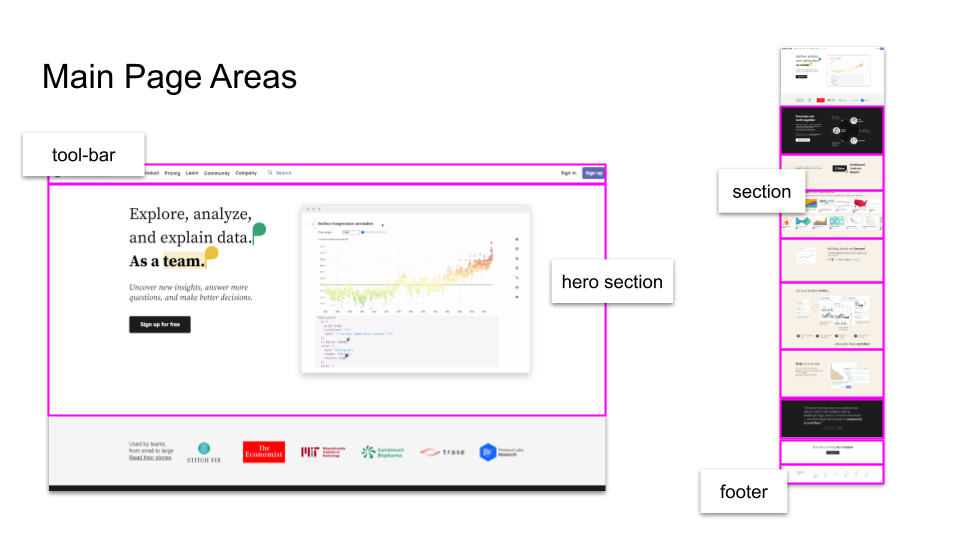
Areas:
tool-bar -
document.querySelector('nav.bb')section -
document.querySelectorAll('#__next > .jsx-2b91b8133a45a7a2 > .jsx-2b91b8133a45a7a2')hero-section -
document.querySelector('#__next > .jsx-2b91b8133a45a7a2 > .jsx-2b91b8133a45a7a2')avatars - d
ocument.querySelectorAll('.marketing-presence-widget.jsx-140043cc736fed23:nth-child(1)')nth-child(2)video (LCP) -
document.querySelectorAll('.mw-section video')
carousel -
document.querySelectorAll('.jsx-1511261573 > .jsx-1511261573 > .jsx-1511261573')DOM animation -
document.querySelector('.jsx-6e9c885e3fde48d5')
footer -
document.querySelector('footer')
Tip: The areas are collected through my audit. Whenever I was identifying an element I was also saving the selector here. I included the method e.g.
to get the list of all relevant elements with the snippet. This will save me some time and I don't need to maintain it in DevTool yet. querySelector
Initial state
To start with our audit we need a reproducible way to measure the status quo, and in what conditions we took the measure.
Audit setup
Target I took the Observable HQ site for the audit as it is a really nice tool and I could maybe provide some benefit to them.
Conditions I used "native throttling" in this audit 🤣, which means all my measures are done in my kitchen with flaky internet connection and no power plug in. 😅 The only thing I made sure was to have everything open in incognito mode.
Device All the measures are done on a ThinkPad X1 (i7 8th Gen) on a Windows OS
Base Measures
The following measures were taken:
Page refresh (a full page refresh triggeres over the performace panel)
Page re-dom (a full removal and adding back of the DOM)
Page re-calculate (transformZ 0.1 on body)
Page idle (after page is fully loaded some seconds of no interaction)
Measure Process
All measures are produced with small scripts I hold in my DevTools Snippets
This is how I performed the measures:
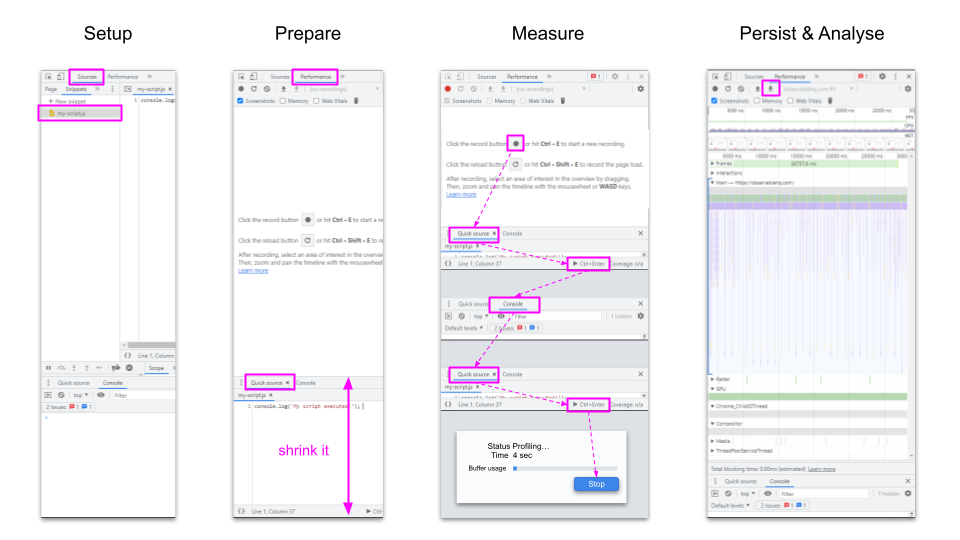
Open the Performance tab
In the bottom section, select the Quick source tab (and close all other tabs)
Start profiling with Ctrl + E or the ⏺ button
Click on the ▶ button to execute the script
Start profiling with Ctrl + E or the ⏹ button
Tip: The
tab pops in after every script execution. This is annoying because we have to click on the consoletab again. To lessen the pain and live-hack it we can shrink the output area to the minimum. By doing this we can have a short distance between the tabs and the execute button. Quick source
Filmstrip Pageload unoptimized

Page Refresh unoptimized
Page Re-draw DOM unoptimized
To reproduce the measure:
Setup the script below as snippet in DevTools -> Sources -> Snippets
Setup DevTools as described in "Measure Process" above.
Start recording
Execute script over "Quick source"
Stop recording
Analyse flames and save the profile if needed
dom-redraw.js
const bi = document.body.innerHTML;
function fullRedom() {
if(window.__pb_full_redom_listener === true) { console.log('You clicked too fast');}
document.body.innerHTML = '';
setTimeout(() => {
window.performance.mark('redom-start');

document.body.innerHTML = bi;
window.__pb_full_relayout_listener = true;

    if (window.__pb_full_redom_listener) {
        window.performance.mark('redom-end');
        window.performance.measure('full-redom', 'redom-start', 'redom-end');
        const duration = window.performance.getEntriesByName('full-redom')[0].duration;
        console.log(`full-redom: ${duration}`, duration > 50 ? '❌' : '✔');
        window.performance.clearMarks();
        window.performance.clearMeasures();
        window.__pb_full_relayout_listener = false;
    }

    }, 400);
}
let runs = 0;
const id = setInterval(() => {
++runs === 4 && clearInterval(id) && console.log('relayout done!');
fullRedom();
}, 2400);
Page Recalculate unoptimized
To reproduce the measure:
Setup the script below as snippet in DevTools -> Sources -> Snippets
Setup tedTools as described in "Measure Process" above.
Start recording
Execute script over "Quick source"
Stop recording
Analyse flames and save the profile if needed
full-relayout.js
function fullRelayout() {
if(window.__pb_full_relayout_listener === true) { console.log('You clicked too fast');}
window.performance.mark('relayout-start');
document.body.style.zoom === '1' ? document.body.style.zoom = '1.01' : document.body.style.zoom = '1';
window.__pb_full_relayout_listener = true;
setTimeout(() => {
    if (window.__pb_full_relayout_listener) {
        window.performance.mark('relayout-end');
        window.performance.measure('full-relayout', 'relayout-start', 'relayout-end');
        const duration = window.performance.getEntriesByName('full-relayout')[0].duration;
        console.log(`full-relayout: ${duration}`, duration > 50 ? '❌' : '✔');
        window.performance.clearMarks();
        window.performance.clearMeasures();
        window.__pb_full_relayout_listener = false;
    }
});
}
let runs = 0;
const id = setInterval(() => {
++runs === 10 && clearInterval(id) && console.log('relayout done!');
fullRelayout();
}, 1000);
Page Scroll
To reproduce the measure:
Setup the script below as snippet in DevTools -> Sources -> Snippets
Setup tedTools as described in "Measure Process" above.
Start recording
Execute script over "Quick source"
Stop recording
Analyse flames and save the profile if needed
// Scroll up down
const scrollHeight = document.documentElement.scrollHeight;

console.log('scrollHeight', scrollHeight);


window.scroll({
  top: scrollHeight,
  behavior: 'smooth'
});

// wait for a second, then scroll back up
setTimeout(() => window.scroll({
  top: 0,
  behavior: 'smooth'
  }), 3000);

console.log('scroll done!');
Page Idle
To reproduce the measure just record the page without any interaction for some time.
Audit Documentation
In the following I will document the different phases of the audit including my thought processes.
First Pokes
After my first impression of the flames and the fact that I can't touch code nor assets I decided to focus first on the things I can easily test and measure. This includes runtime measures of DOM and CSS changes.
Here the transferred list from my handwriting as I was too lazy to start a readme right away.
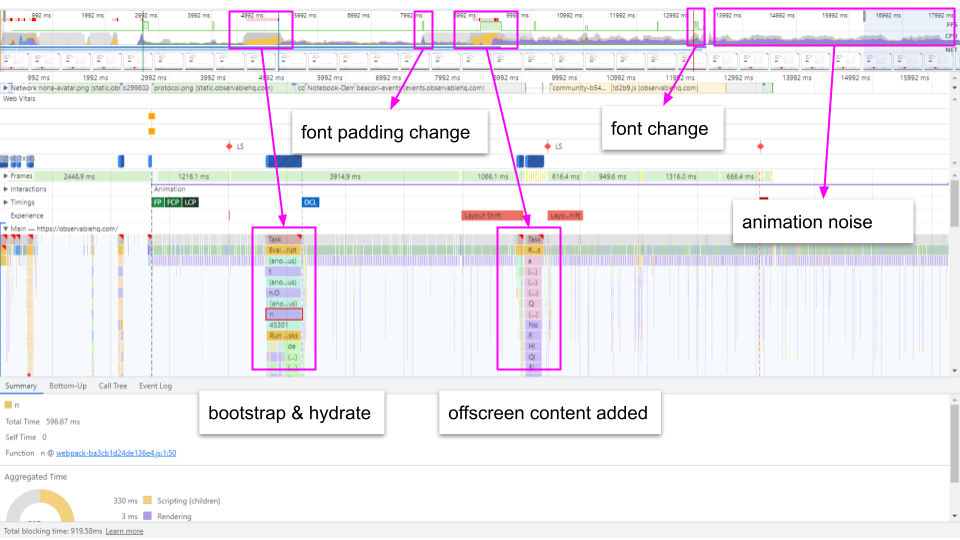
First Quick Findings
Scripting:
script driven animations
bad lib for DOM animation
DOM & Styles:
animation noise
styled components triggering refetch of resources (check in hero section)
Media:
no UI facade for hero GIF
lazy loading options present
no compression
wrong dimensions
To be more productive I try to focus the audit process on the same technique across the page and then switch to the next one I think is applicable.
Phase 1 - Low hanging fruits & discovery
loading
loadingAfter a look in the delivered HTML I have a little hope we can land an impact with lazy loading resources as they already have it in use pretty much every where.
Let's quickly check the images without loading lazy on the page...
const imgs = document.querySelectorAll('img');
const eager = Array.from(imgs).map(i => i.getAttribute('loading')).filter(l => !l).length;

console.log(eager+ ' of ' + imgs.length + ' imgs eager (LCP included)');
document.title= eager+ ' of ' + imgs.length + ' imgs eager (LCP included)';
82 of 137 imgs eager (LCP included)
Let's give it a quick try 😁
const imgs = document.querySelectorAll('img');
const eager = Array.from(imgs).forEach(i => i.setAttribute('loading', 'lazy);
At pageload 3113
containcontent-visibility
containcontent-visibilityI start with the quick wins first and work my way through the previously defined sections.
Tool-bar
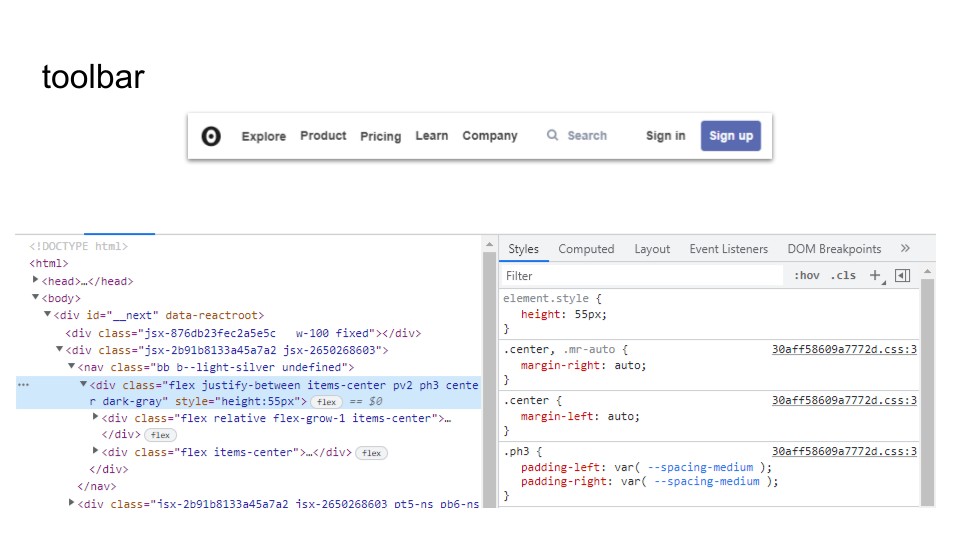
The tool-bar is my first candidate. A clear case for contain:strictheight: 55px
It will be off screen when we scroll so we can consider content-visibilitycontain-intrinsic-size
I don't measure as I don't assume any big impact.
The interactions with tool-bar elements did not show any animated changes nor dropdowns. The only interesting thing was that when I clicked the searchbox a full page overlay showed up. At the beginning I did not see it but after some interaction I spotted a flicker in the tiny images of the headline.
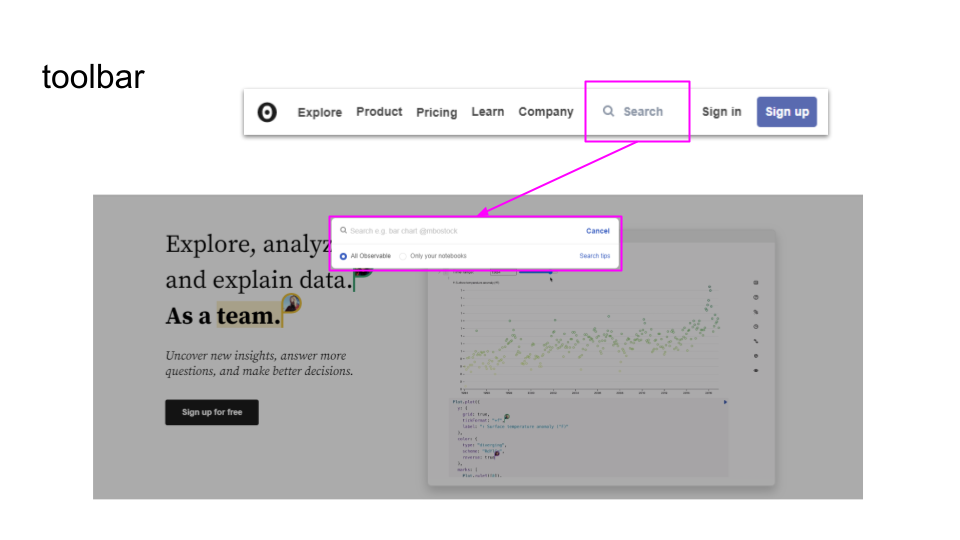
Let's make a note for the hero section to analyze this.
Sections
The majority of the pages content is organized in sections with mid size DOM size. In general the site is media heavy but there are some specific sections containing more relevant animation or media we could have a look at.
We can try if their content is stay stable if we apply content-visibility:auto300px
Looks good! Recalculate styles and redom shows pretty nice improvements already.
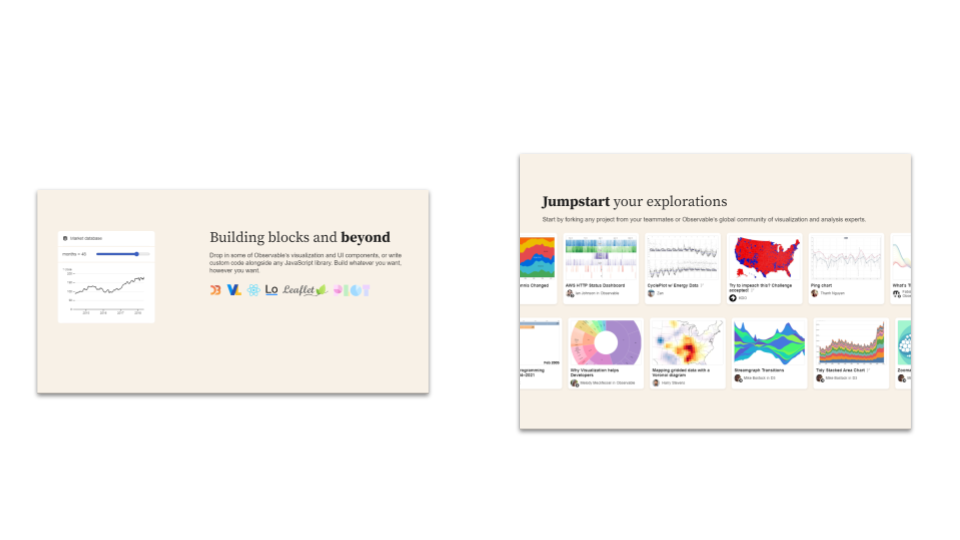
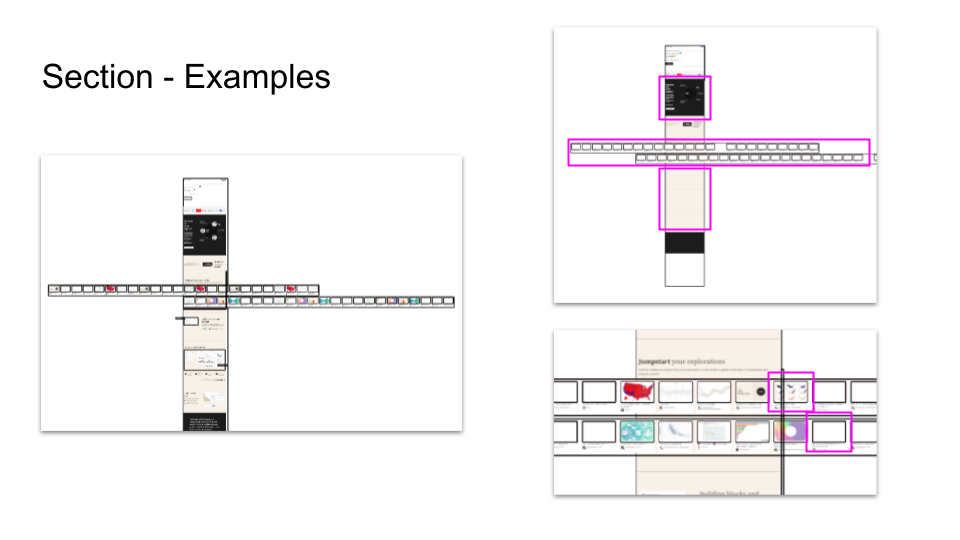
Section - Examples
One of the interesting sections is the examples section. There we have 2 carousels containing main cards with images.
Their position is animated with translateX which is already pretty good. As a side effect the paint area is huge.
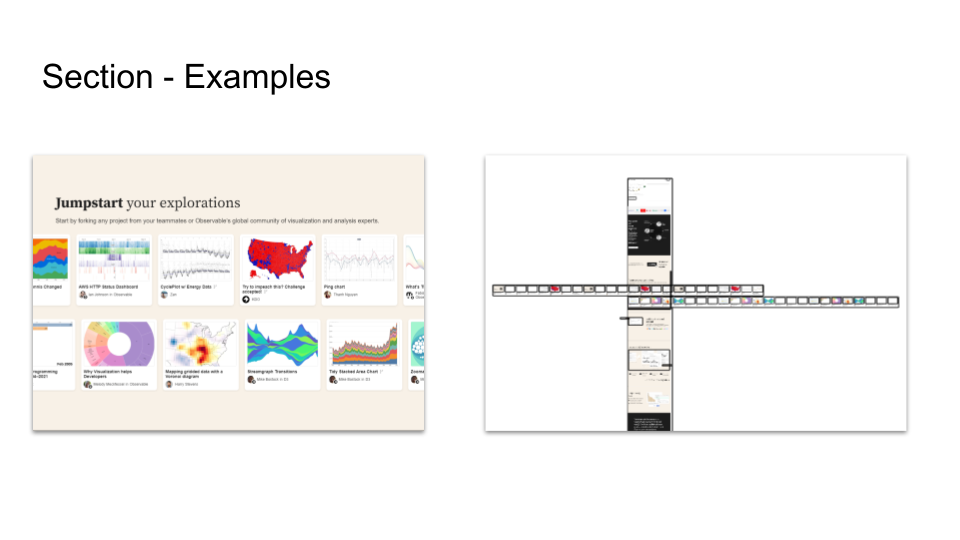
Here we can try to apply containcontent-visibilitycontent-visibility
img, video {
  contain: content;
  content-visibility: auto;
}
As this most probably will have an impact on other images and paint heavy assets too, let's add another rule for all imgvideo
.carousel-notebook {
  contain: content;
  content-visibility: auto;
  contain-intrinsic-size: 200px;
}
After we applied the styles we can see in the layers panel that the paint area is now limited to the cards visible in the viewport or obscured. Another check in the layers panel shows us the affected nodes.
Section - Usage
A quick look with the paintflash feature shows that again they did quite a good job, transition is used to run the dimensional changes.
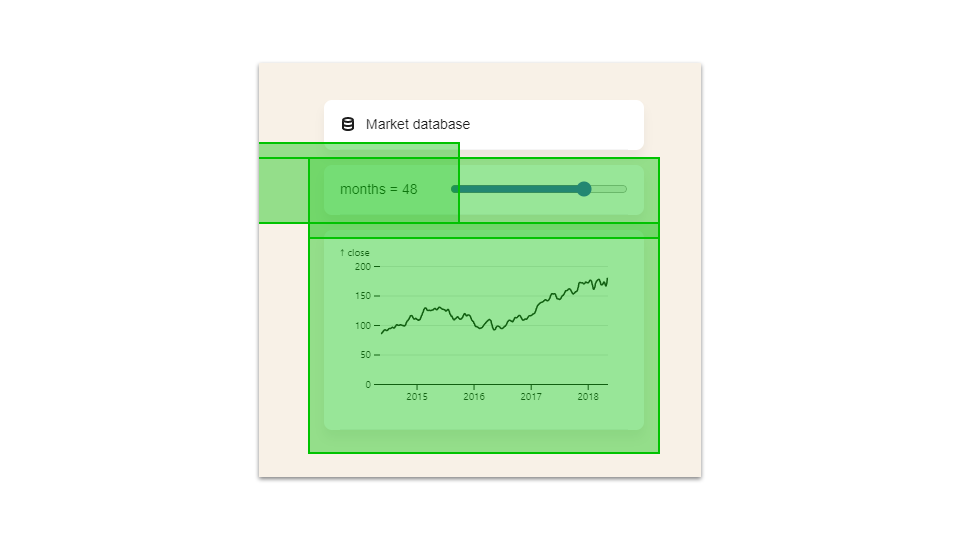
Maybe a small improvement could be done with will-change
From what I understand now, the animation is driven by transform and some properties are translated. The animated elements are all contained by on container with fixed widthheight
I can access all selected elements like this document.querySelectorAll('.jsx-6e9c885e3fde48d5 > div')
I can start now to fiddle around, but first I have to stop all the background noise so I can focus on the one animation.
// hero video
document.querySelector('#__next > .jsx-2b91b8133a45a7a2 > .jsx-2b91b8133a45a7a2').remove();
// carousel
Array.from(document.querySelectorAll('.jsx-1511261573 > .jsx-1511261573 > .jsx-1511261573')).forEach(i => i.remove());
As the DOM changes and it's hard to make changes directly on the element in the Elements tab, I first add a class that I can target:
// animated divs
Array.from(document.querySelectorAll('.jsx-6e9c885e3fde48d5 > div')).forEach(i => i.classList.add('animated-elem'));
Ok, unfortunately my default approach does not work, the class attribute is controlled by JavaScript and I have to go with a data
Array.from(document.querySelectorAll('.jsx-6e9c885e3fde48d5 > div')).forEach(i => i.setAttribute('data-xyz', 'inner'));
Array.from(document.querySelector('.jsx-6e9c885e3fde48d5')).forEach(i => i.setAttribute('data-xyz', 'container'));
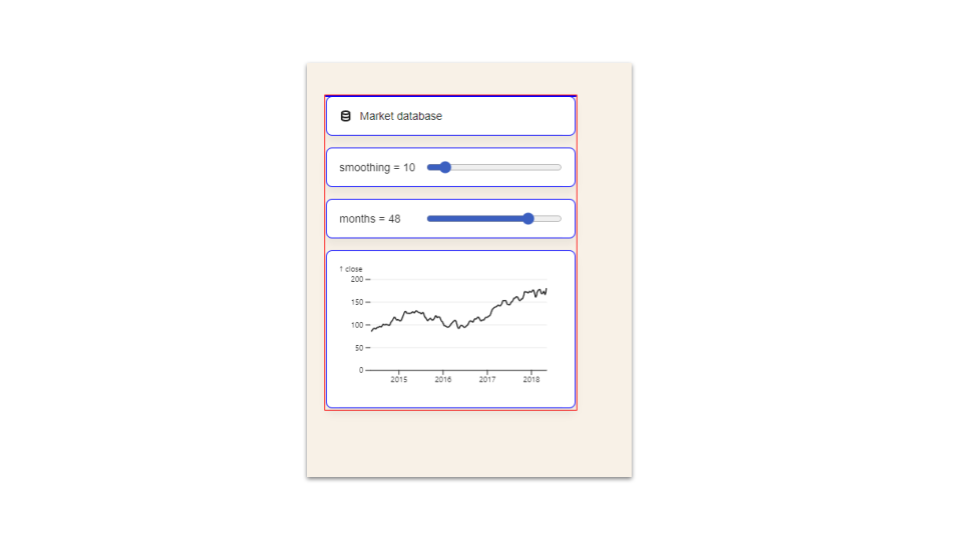
With a little bit of CSS I can now target and visually identify the involved elements:
[data-xyz="container"] {
  border: 1px solid blue;
}
[data-xyz="inne"] {
  border: 1px solid red;
}
After some time spent with those 6 elements I did the following thing:
[data-xyz="container"] {
  contain: layout;
}
[data-xyz="wrap"] {
  contain: layout;
  will-change: height;
}
[data-xyz="inner"] {
  contain: strict;
  content-visibility: auto;
}
Footer
The footer is another clear candidate for our silver bullets ;), Let's see what we can do.
footer {
  contain: content;
  content-visibility: auto;
  contain-intrinsic-size: 200px;
}
Pretty nice we could even maintain the height exactly.
Phase 2 - View Port and LCP Detailed Look
Section - Hero
The hero section maintains a little bit of fancy text and a video.
From the toolbar review I have a note regards a flicker in the tiny images of the headline on the right. When opening and closing the search overlay I realized that some images are constantly loaded. 2 images visible in the small bubbles in the headline.
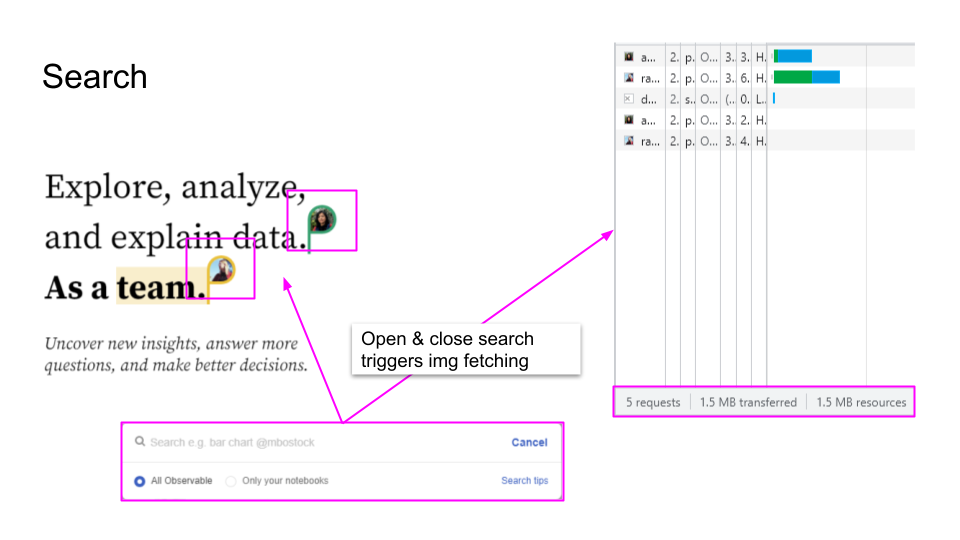
A second look in comparison to the rest of the resources showed that these 2 images are with far distance the biggest on the page. 🤣
Due to the usage of CSS and the background-image attribute the priority is always high
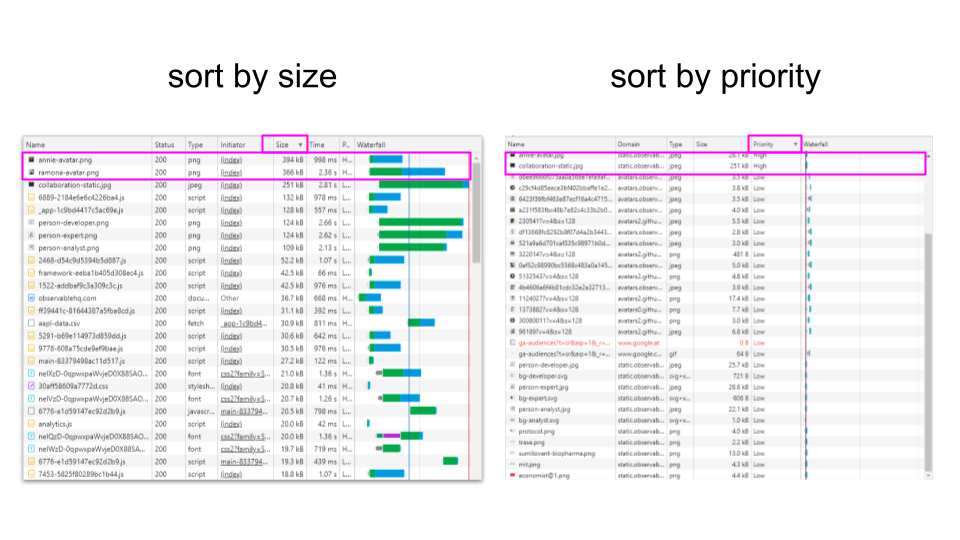
I assume it is triggered by react's CD and the usage of CSS variables as background image but I'm not sure ATM.
For now I will keep it with a note to research later...
LCP Asset
The video tag on the right is streamed so the first image can get displayes early on.
Here we can apply our finding from above to our advantage. We can use an image and set it as the background image of the video tag. As this is our LCP and the CSS rule will fetch it with high priority we could create an optimized image for the first paint to improve LCP.
In the snippet below I just used an image from the cards to showcase the effect. For a visual feedback you can add a background color to check the impact visually.
.mw-section video {
  background-image: url(https://static.observableusercontent.com/thumbnail/820c1ce779bde2347e128aab81a550e16f95126993729412583ac517dd0c2c1f.jpg);
/* just to demonstrate impact visually */
background-color: red;
}
Phase 3 - Hero section avatar images
I'm back at the image flicker 🥰. This was gripping my attention from the beginning but I was not sure if it has enough potential to dig in deeper, so early on. Now that I am pretty satisfied with my first findings I can finally have a closer look here.
I realized I did not put the selector for the small bubbles containing the avatar image in the doc before... 🙄 Again a turn with the element inspector ... meh! ... and the console.
Here we go:
// avatar 1 - element
document.querySelectorAll('.marketing-presence-widget.jsx-140043cc736fed23:nth-child(1)');
// avatar 1 - URL
https://static.observablehq.com/assets/annie-avatar.jpg
// avatar 2 - element
document.querySelectorAll('.marketing-presence-widget.jsx-140043cc736fed23:nth-child(2)');
// avatar 2 - URL
https://static.observablehq.com/assets/ramona-avatar.jpg
Now as I remember, I wanted to use a random profile picture from a card to show case the impact. Let me do that right now where I am in the elements panel mood...
// dummy avatar 1
https://avatars.observableusercontent.com/avatar/4b4606a6f4b81cdc32e2a3271381da5fad8ffdbd1089b14e89ebcfd1c98a11c0?s=128
// dummy avatar 2
https://avatars2.githubusercontent.com/u/96189?v=4&s=128
Ok. Now as I am prepared with some snippets let's finally dig.
I will open the network tab to see if a block of those image URL's has an impact.
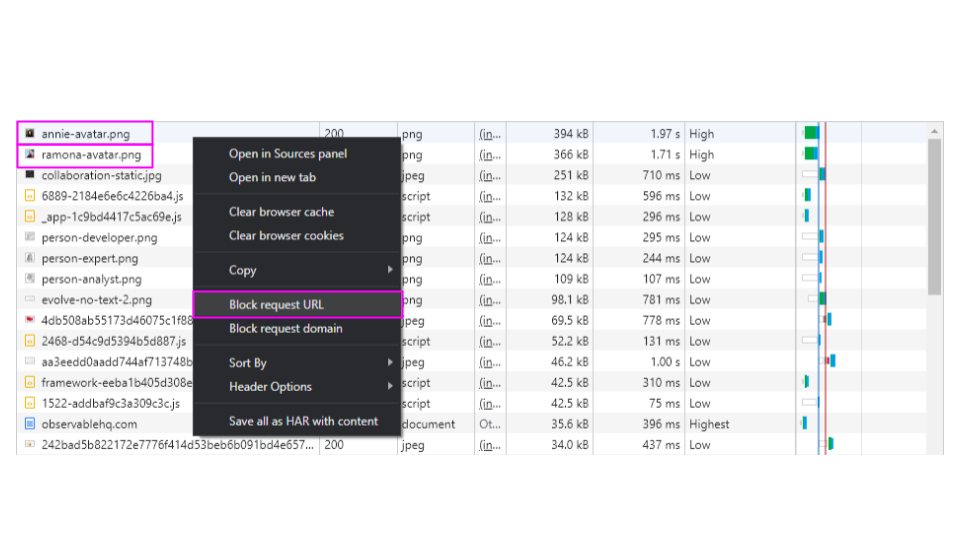
Woof, only from observing it over the screen it is a drastic difference. Also the network waterfall looks way more "parallel".
It definitely pays off to think about a solution here!
My first try to change "something" was to just replace the CSS variable value, but it seems it is somewhere recalculated to the same value and set again... hmm.
element.style {
 /* new url below */
 --presence-avatar: url(https://avatars.observableusercontent.com/avatar/4b4606a…?s=128);
}
Let's try to go with static CSS values and selectors.
.marketing-presence-widget.jsx-140043cc736fed23:nth-child(1):after {
  background-image: url(https://avatars.observableusercontent.com/avatar/4b4606a6f4b81cdc32e2a3271381da5fad8ffdbd1089b14e89ebcfd1c98a11c0?s=128);
}
.marketing-presence-widget.jsx-140043cc736fed23:nth-child(2):after {
  background-image: url(https://avatars.observableusercontent.com/avatar/4b4606a…?s=128);
}
Voila! 💪 The refetching is now gone and also a properly sized image is used, only the fetch priority is still on Highbackground-image
/* reset background-image */
.marketing-presence-widget.jsx-140043cc736fed23:after {
  background-image: none !important;
}

.marketing-presence-widget.jsx-140043cc736fed23 {
  positing: relative;
}

.marketing-presence-widget.jsx-140043cc736fed23 img.avatar {
  top: -28px;
  position: relative;
  z-index: 10;
  border-radius: 50% 50% 50% 3px;
}
Perfect after this improvement they also have fetch priority low
Phase 4 - Hero section video
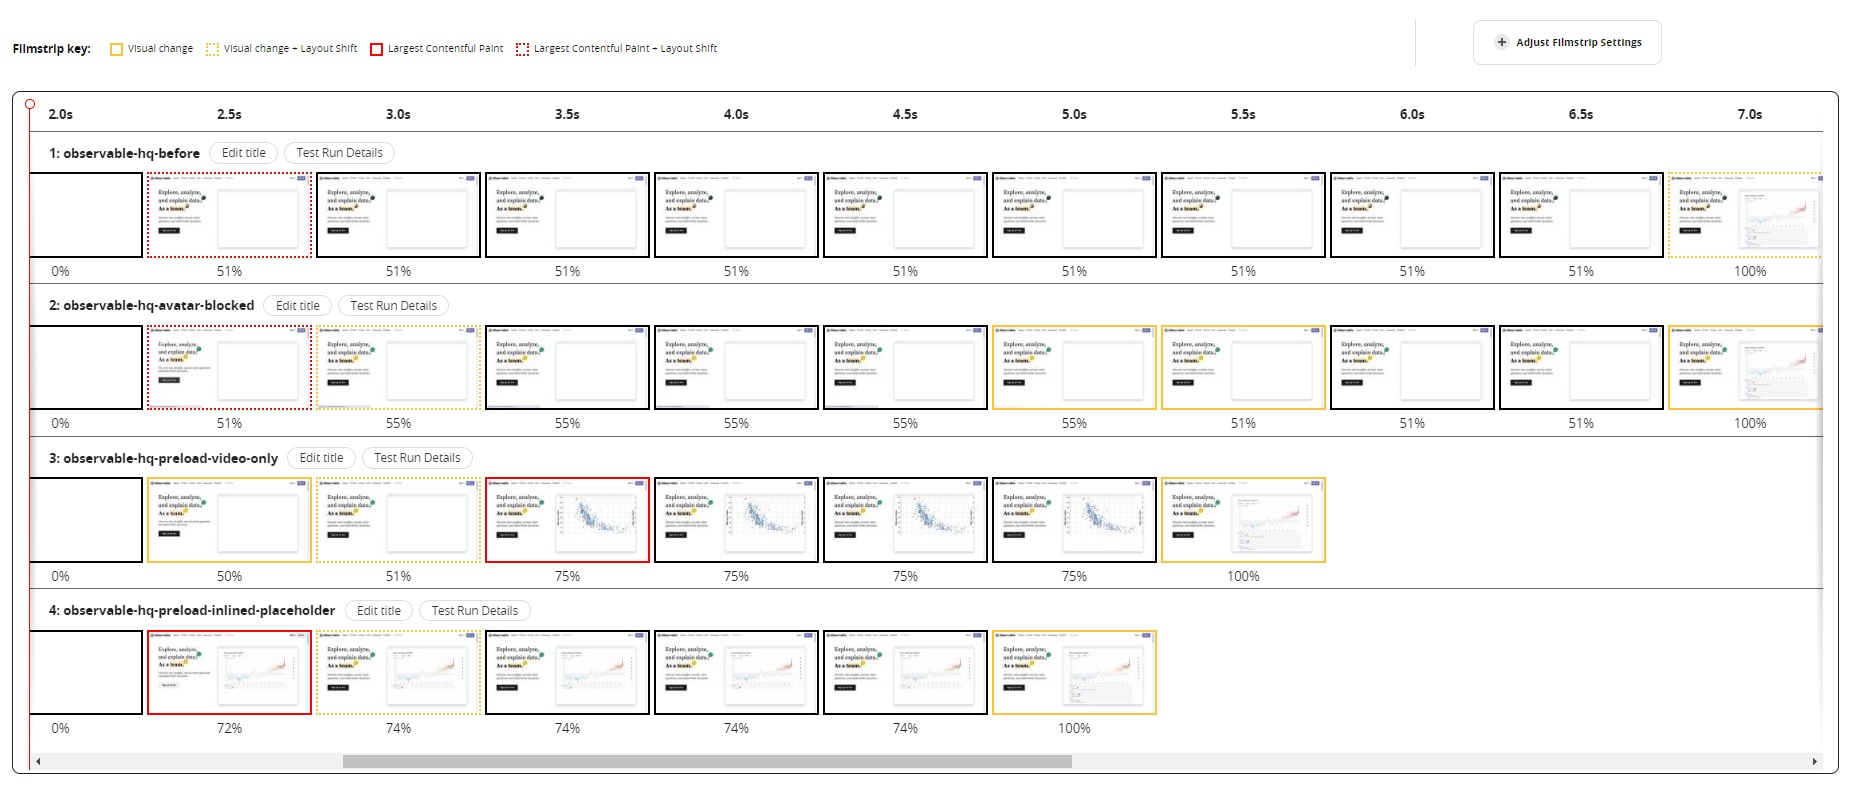
After I added the optimized measures and the TL;DR section I tried to somehow visualize the hero video impact as it is a major improvement of this audit and therefore it should shine.
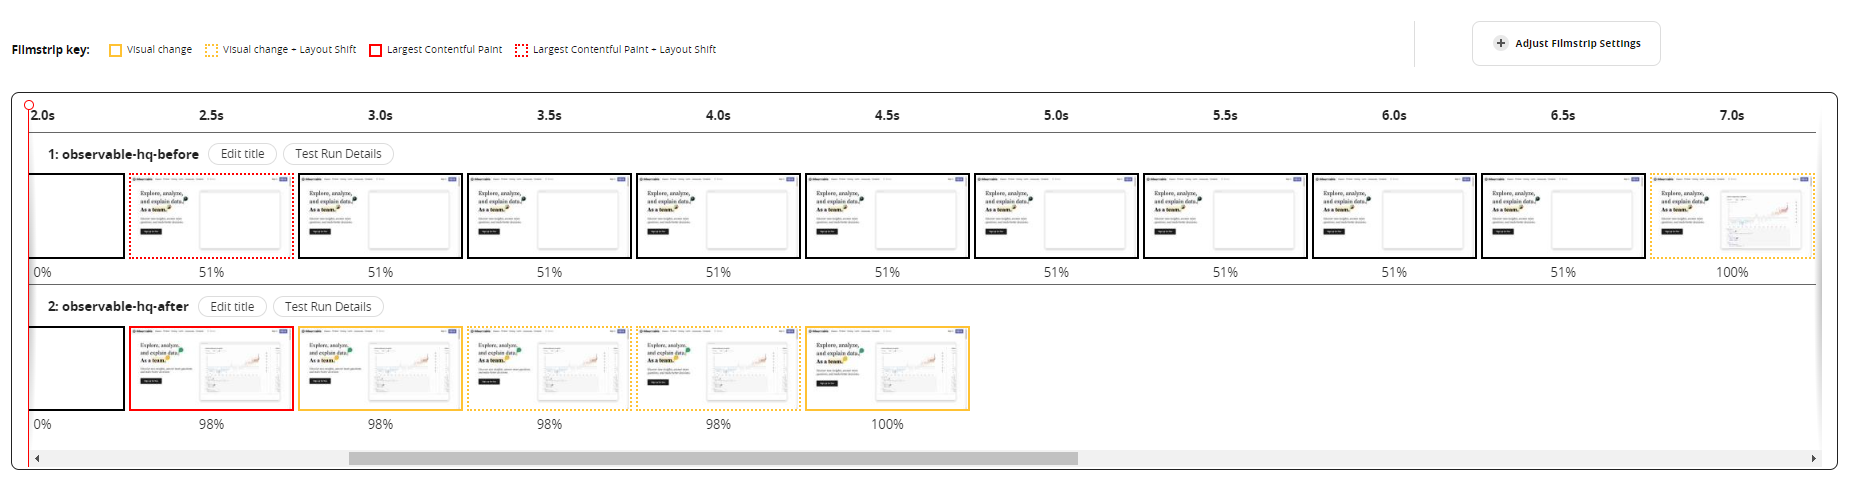
Let's use filmstrips to visualize the impact:
Before

I started by fixing the initial height of the image with min-height:427px
Placeholder polishing
To make the smithc from the placeholder to the video less visible I create a custom placeholder image. I make a screenshot, open squoosh.app upload my image and start tweaking until I have around 9KB (initially it was 105KB) and used www.base64-image.de to make it a base64 string.
I started to preload it to get a faster paint and after some measures I decided to inline it. Way faster and easier to apply. The background-image: url()
Video
To improve the video loading I started to experiment with preloading attributes on the image, but as this will still wait to fetch until the DOM is fully parsed I went with <link rel="preload" as="fetch" href="https://static.observablehq.com/assets/videos/Notebook-Demo.mov">
I'm nervous... :)

REALLY NICE!!! 🔥🔥🔥
This nice improvement series deserves a image showing the evolution of this improvement.
Herosection final snippet
const parser = document.createElement('DIV');
function parse(html) {
parser.innerHTML = html;
return parser.firstChild;
}
const v = parse('');
const s = parse("");
document.body.prepend(v);
document.body.prepend(s);
🗣 Memo to myself: Never maintin base64 images in a readme again!
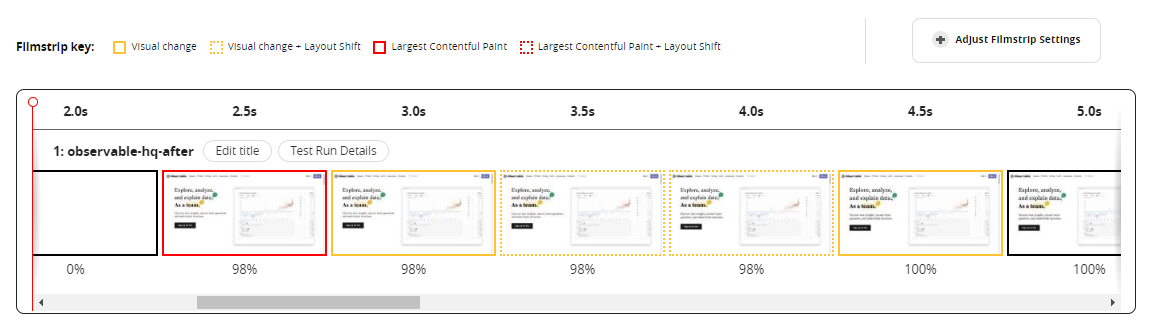
Optimized State
Measures after application of all optimizations
Filmstrip Pageload optimized
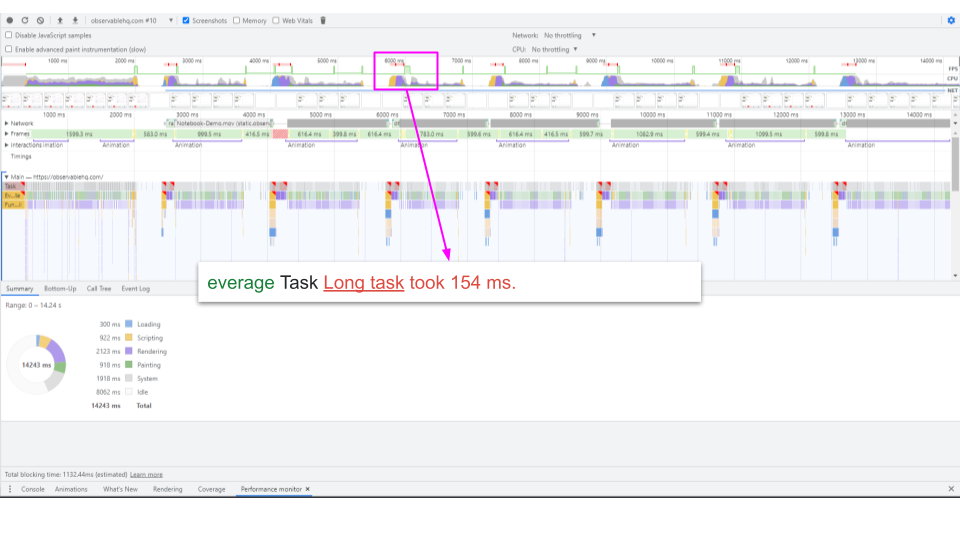
Page Refresh optimized
We can't run this comparison easily so we skip it for now.
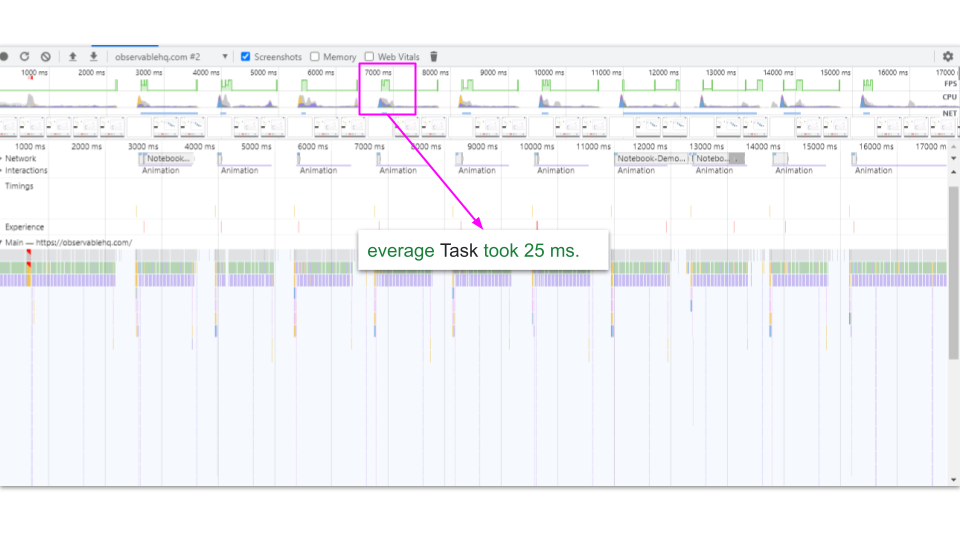
25ms before 154ms
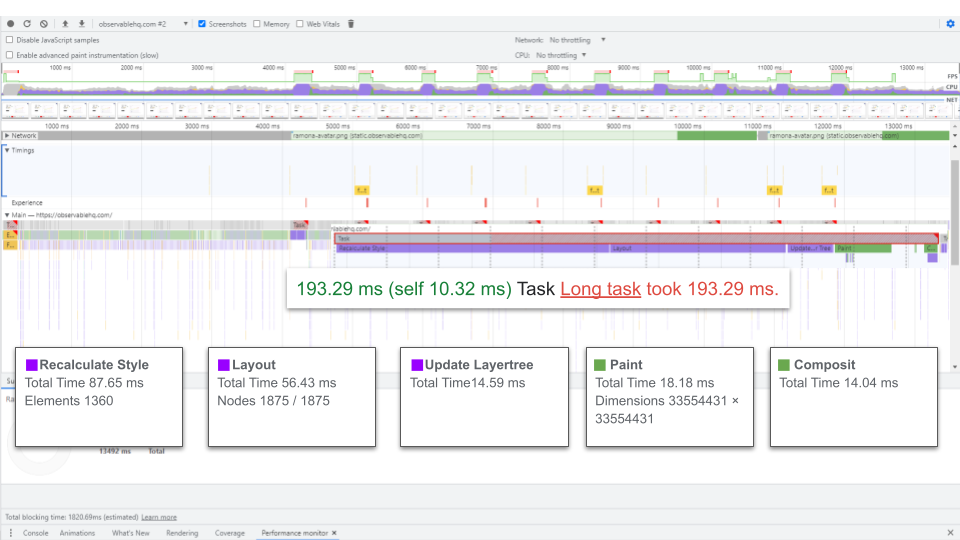
Page Recalculate optimized
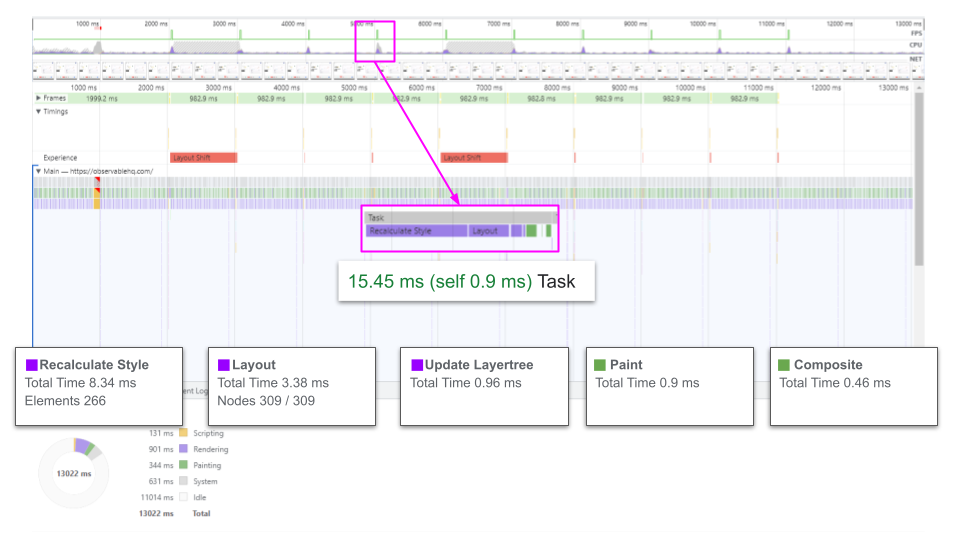
15.45ms before 194ms
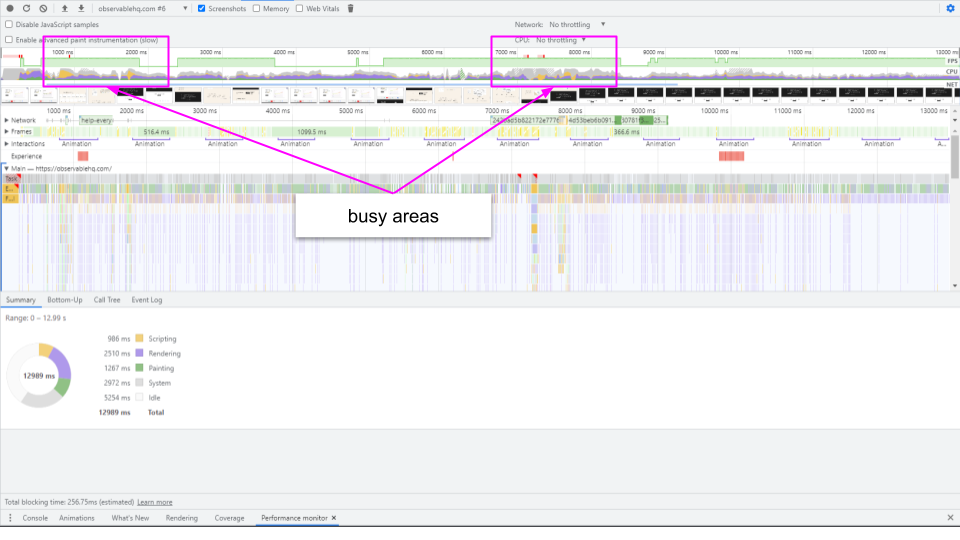
Page Scroll optimized
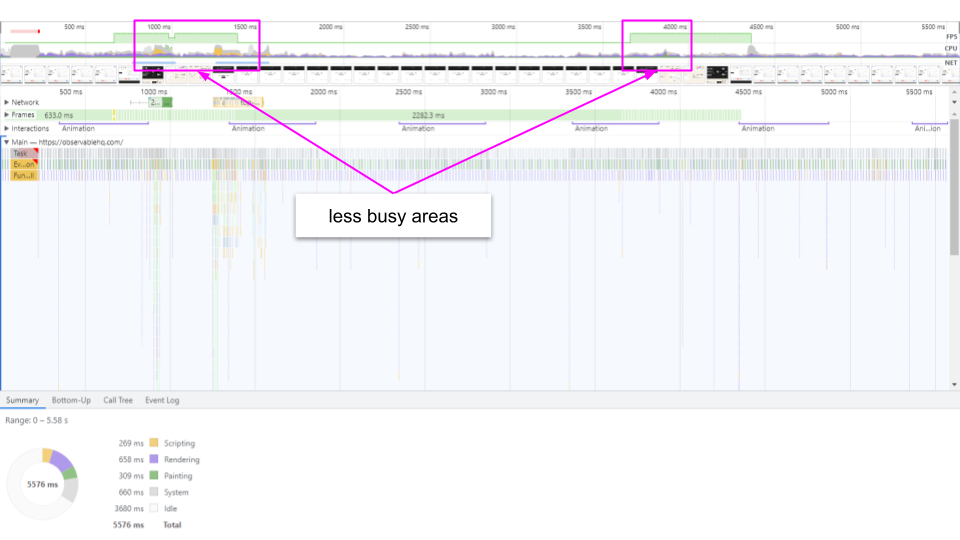
No busy areas anymore.
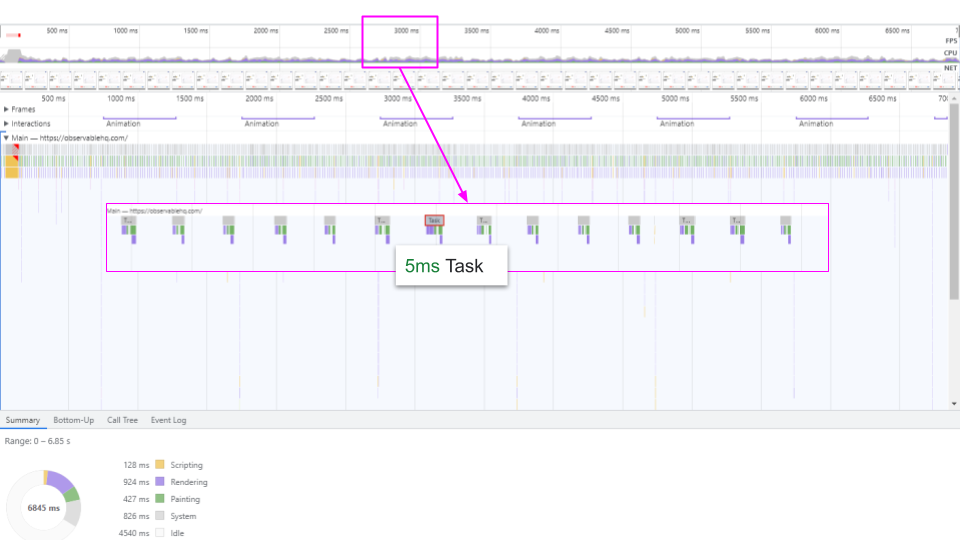
5ms before 20ms
Comparison
Measurements in comparison
Filmstrip Pageload comparison
Page Re-draw DOM comparison
Page Recalculate comparison

Page Idle comparison
Resources
Attachments
Raw files and screenshots of measurements can be found in the
directory. /raw
Performance profiles
Raw performance profiles can be found in the
directory and viewed in GitHub or in the performance view locally or online. /raw
Name | Timeline | Size |
|---|---|---|
observablehq-idle_after.json | timeline-view | 24.16 MB |
observablehq-idle_before.json | timeline-view | 8.6 MB |
observablehq-recalculate_after.json | timeline-view | 13.37 MB |
observablehq-recalculate_before.json | timeline-view | 21.61 MB |
observablehq-reDom_after.json | timeline-view | 20.48 MB |
observablehq-reDom_before.json | timeline-view | 16.53 MB |
observablehq-scroll_after.json | timeline-view | 14.62 MB |
observablehq-scroll_before.json | timeline-view | 10.81 MB |

Advanced workshop
Architecting Angular Apps for High Performance
High-Speed Angular applications on any device
Learn moreRead next

Goodbye 'ControlValueAccessor', Hello Signals! 👋🚦
Angular is bridging the gap between the new Signal-Forms architecture and the Template/Reactive Forms. This isn't just a minor update—it’s a fundamental shift in how we author custom form controls.

What Is LCP And Why It Matters: Unlock Instant Page Experiences - Part 2
Part 2 is a practical walkthrough to diagnose and speed up LCP. Learn to read CrUX trends, profile in Chrome DevTools, preload critical assets, use srcset, defer third-party scripts, and code-split Angular bundles to turn red LCP into green.


Angular Aria: Building Web Accessibility Beyond Compliance (Part 1)
Accessibility doesn’t have to be hard. Follow a comic-style, hands-on journey building an accessible day selector with Angular Aria, learning comboboxes, listboxes, and real screen reader behavior along the way.

Advanced CPU Profiling in Node - Real-Life Examples
Profiling is easiest when it's real. Learn how to capture and make sense of CPU profiles in Node.js across scripts, threads, and processes—then apply it to your own projects.

Angular v21 Goes Zoneless by Default: What Changes, Why It’s Faster, and How to Upgrade
If Signals were Angular’s “aha!” moment, Zoneless is the “oh wow—this feels snappy” moment. With Angular v21, new apps use zoneless change detection by default. No more zone.js magic under the hood—just explicit, predictable reactivity powered by Signals.
What Is LCP And Why It Matters: Unlock Instant Page Experiences - Part 1
Largest Contentful Paint (LCP) is a Core Web Vital that shapes user perception of speed. This first part explains what LCP is why it matters for SEO and business, and how its phases affect site performance.