
TypeScript Performance Workshop
As TypeScript codebases grow, slow type checking, longer builds, sluggish editor feedback, and heavier CI pipelines can start to drag down developer productivity.
This advanced TypeScript Performance Workshop gives experienced developers a structured methodology for measuring, investigating, and improving TypeScript compiler performance. You will learn how the compiler works, where performance costs occur across the CLI, IDE, and CI, and how to identify the bottlenecks that matter using diagnostics, traces, CPU profiles, and supporting analysis tools.
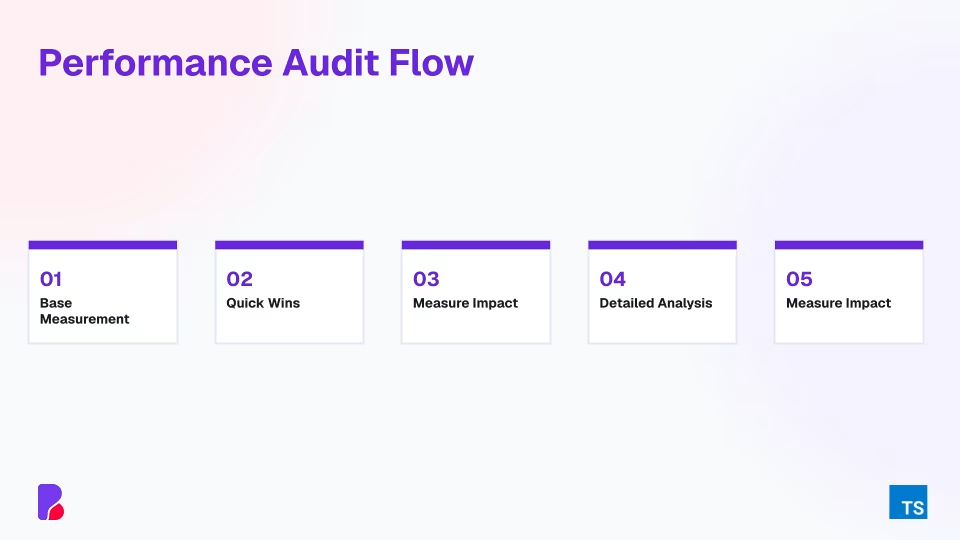
The workshop then moves into practical optimization across tsconfig and project configuration, project references and monorepos, module resolution, declaration and emit work, IDE language-service overhead, and expensive type-level patterns. Through live demonstrations and guided exercises, you will work through a repeatable investigation flow: establish a baseline, identify quick wins, measure impact, analyze deeper bottlenecks, and verify improvements.
We also cover the performance architecture introduced with TypeScript 7, including the native Go compiler and shared-memory multithreading. You will learn how this changes the performance baseline for large TypeScript projects and where project structure, configuration, and type design still influence compiler performance.
The workshop is designed for experienced TypeScript developers and focuses specifically on compiler, type-checking, and developer-workflow performance.
Is this workshop for your team?
This workshop is particularly relevant if your team is experiencing one or more of the following:
TypeScript builds or type checking have become noticeably slower as the project has grown
Developers experience slow editor feedback or language-service performance
TypeScript has become a significant part of CI execution time
Your codebase or monorepo contains complex generic or type-level logic
Your team has tried individual compiler options or quick fixes but lacks a systematic investigation process
You want to keep TypeScript performance visible and prevent regressions as the codebase continues to scale
Prerequisites
Solid TypeScript experience. Language fundamentals are not covered.
Comfort working with tsconfig, the command line, and an existing TypeScript project.
Basic familiarity with build and CI workflows is helpful for the performance investigation sections.
Find bottlenecks with data
Know where compiler work happens across CLI, IDE and CI, using diagnostics, traces and CPU profiles instead of assumptions.
Read the metrics that matter
Interpret time, files, types, instantiations, resolution and memory, and follow a repeatable investigation workflow your team runs independently.
Cut work through configuration
Tune tsconfig, project references and file boundaries to cut resolution, declaration, emit and editor work in large monorepos.
Rewrite expensive type patterns
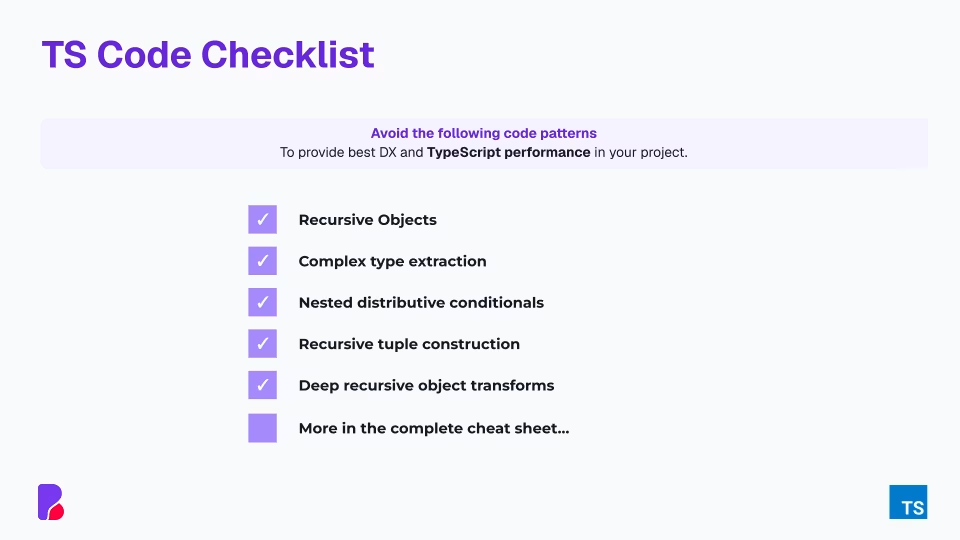
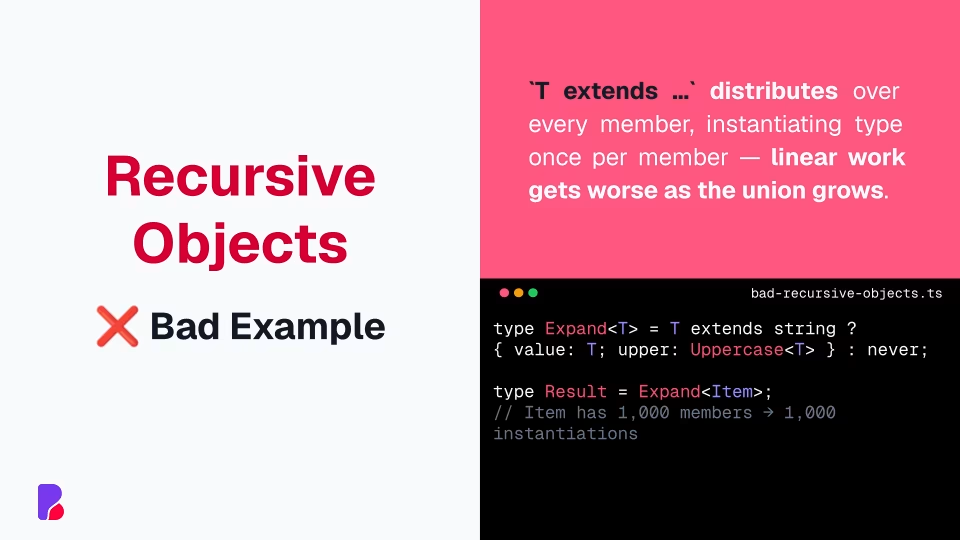
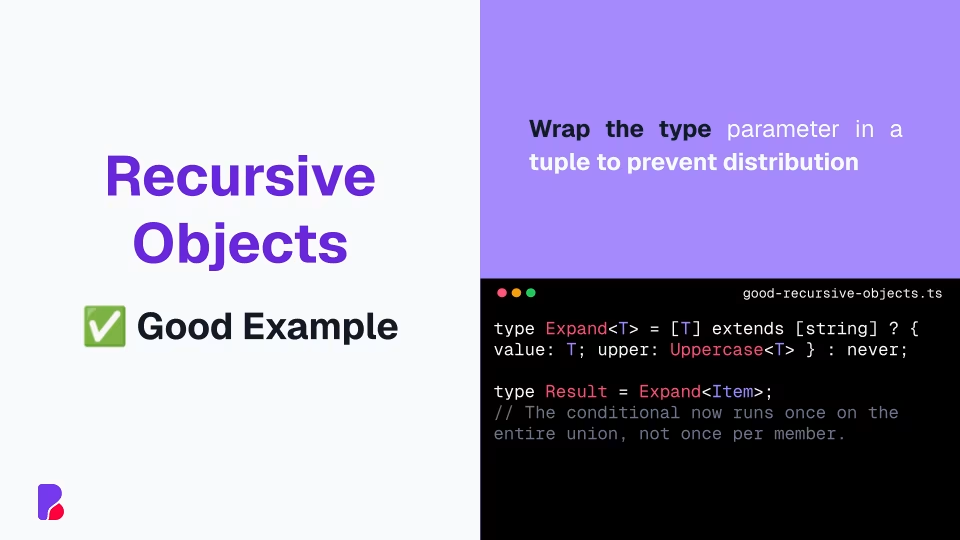
Spot costly patterns like distributive or nested conditionals and recursive types, then rewrite them and measure the difference.
Know what TypeScript 7 changes
See what the native TypeScript 7 compiler speeds up, and which bottlenecks still come from structure, configuration or type design.
Keep it fast at scale
Measure TypeScript performance continuously in CI, keeping changes verifiable and giving your team a method for future problems.
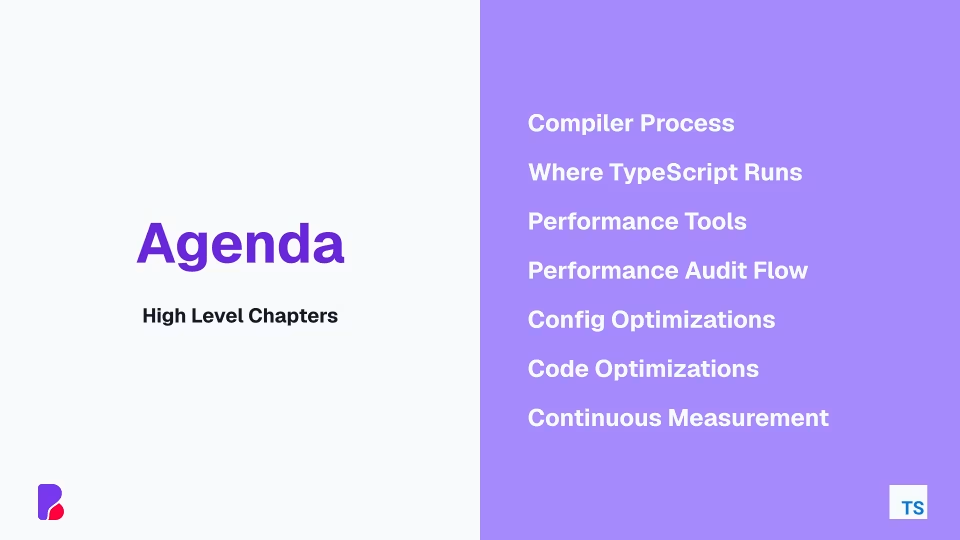
TypeScript Performance
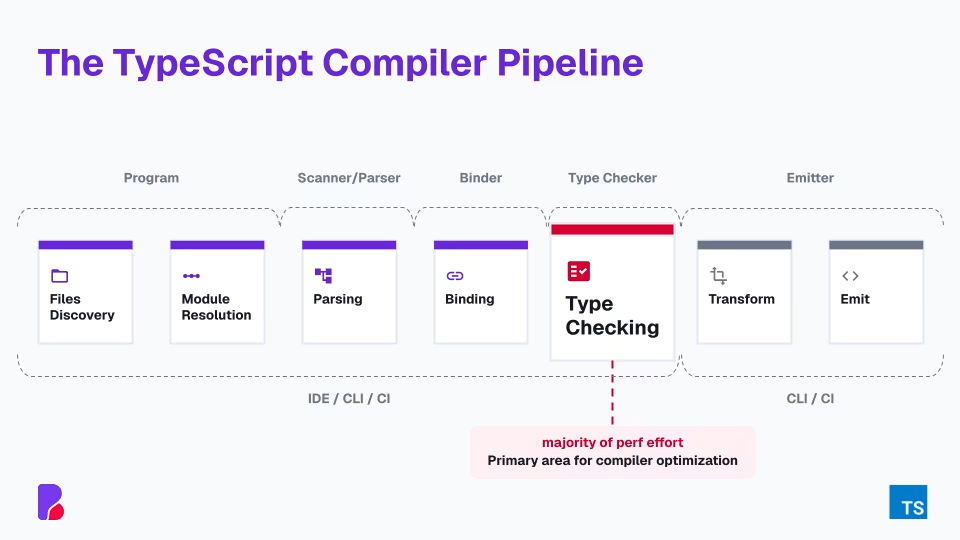
How the compiler works
File discovery and resolution
Parsing, binding and checking
Transforming and emitting output
Where optimization matters most
Where TypeScript runs
CLI, IDE and CI
Impact on builds and editors
Different problems per environment
TypeScript 7 native compiler
Native Go compiler, multithreaded
A new performance baseline
What upgrades fix automatically
Large projects after upgrading
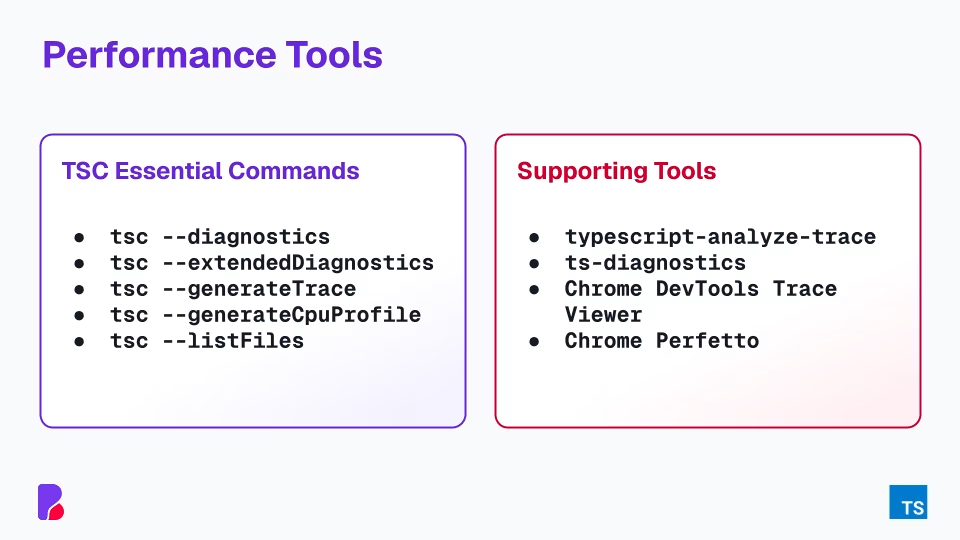
Compiler diagnostics
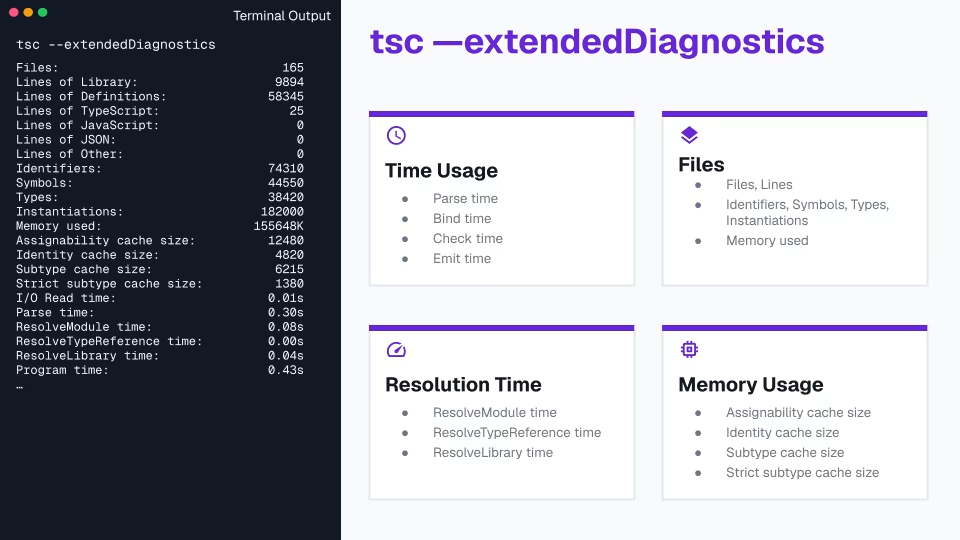
Timing and workload overview
Extended timing and memory metrics
Traces and CPU profiles
Inspecting included files
Supporting analysis tools
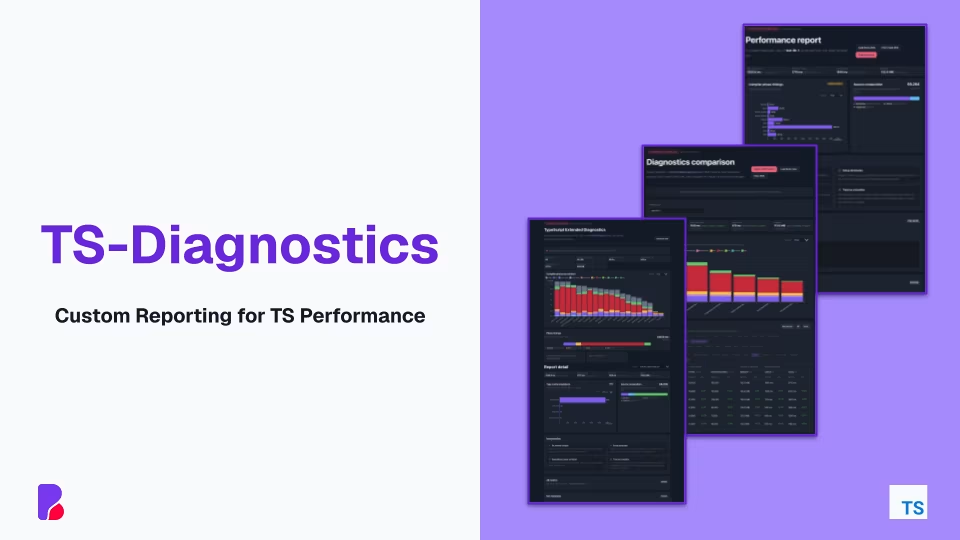
typescript-analyze-trace and TS-Diagnostics
Chrome DevTools and Perfetto
From raw output to findings
Reading the metrics
Parse, bind, check, emit time
Files, types and instantiations
Resolution, memory and caches
Matching metrics to problems
Performance audit workflow
Overview and detailed baseline
Quick wins first
Detailed analysis and type optimization
Measure, compare, repeat
tsconfig and project structure
Prioritize changes by impact
Project references and monorepos
Fewer files, leaner resolution
Lighter declarations, emit and IDE
Efficient type design
Distributive and nested conditionals
Recursive tuples and objects
Union reduction, interfaces over intersections
Spot expensive patterns early
Hands-on type optimization
Measure an expensive type
Find the costly behavior
Refactor the type structure
Verify before and after
Preventing regressions
Metrics worth tracking
Repeatable measurements
Performance checks in CI
Visibility as code evolves
Preview of the workshop
Meet the trainers

Michael Hladky
 Google Developer Expert
 Microsoft MVP
 Auth0
 Trainer
 Nx Champion

Julian Jandl
 Performance Expert
- Trainer
- Nx Champion

Enea Jahollari
- Google Developer Expert
- Performance Expert
 Architecture Expert
- Trainer