Debugging Angular SSR: Tales of Pending Task, Hydration, Race Conditions | Julian Jandl & Michael Hladky @ NgIndia 2026
About the event
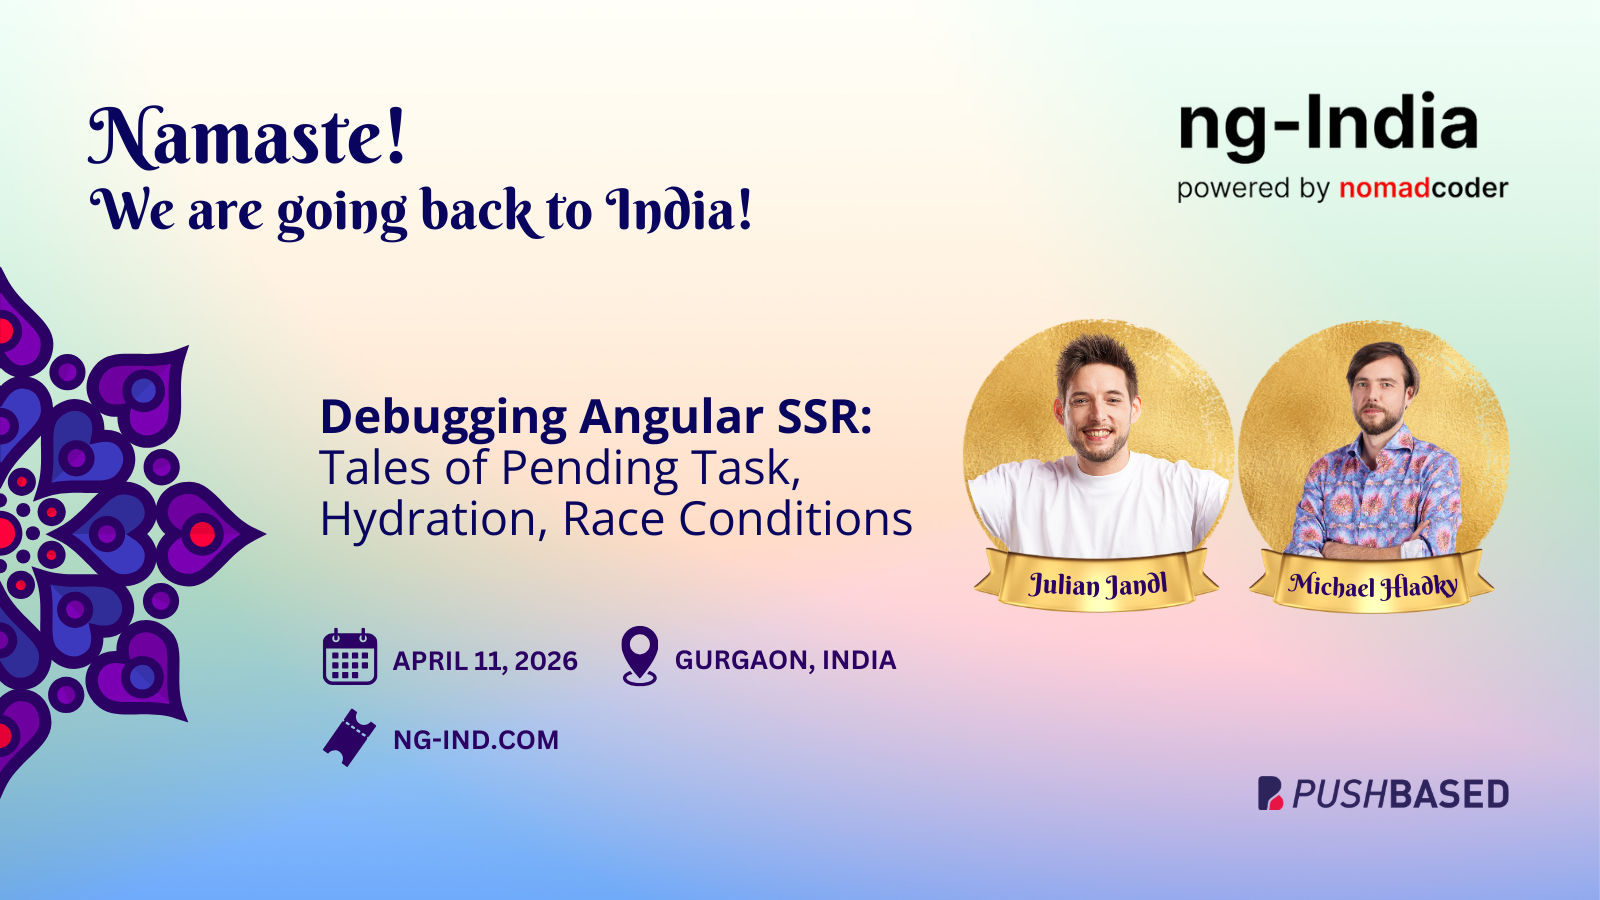
Debugging Angular SSR: Tales of Pending Task, Hydration, Race Conditions
Angular SSR promises to improve your application Core Web Vitals and SEO, but it also introduces a layer of complexity. This session gives attendees the key concepts and practical techniques needed to migrate an Angular app to server-side rendering with confidence.
We will explore how Angular SSR works under the hood, with a focused deep dive into execution context differences between server and browser, the realities of running in two runtimes, and what “stability” means during SSR. You’ll learn how pending tasks—timers, intervals, unresolved async work, and subscriptions—can silently keep renders open and how to diagnose and prevent that. We’ll also cover hydration debugging: spotting mismatches, avoiding duplicated side effects, and fixing issues like flicker or full client re-renders that undo SSR’s benefits.
Preview of the talk
Meet the speakers

Julian Jandl
 Performance Expert
 Trainer
 Nx Champion

Michael Hladky
 Google Developer Expert
 Microsoft MVP
 Auth0
Auth0- Trainer
- Nx Champion
Keep exploring
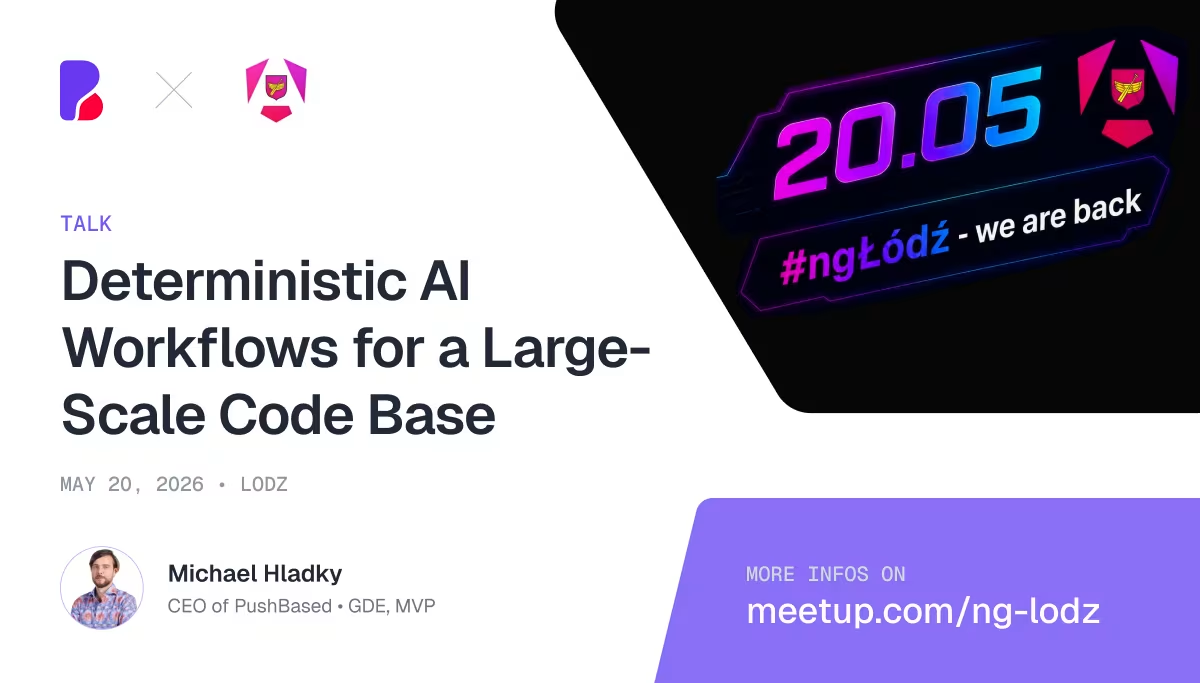
Deterministic AI Workflows for a Large-Scale Code Base | Michael Hladky @ ngLodz
ngLodz
May 20, 2026 · Lodz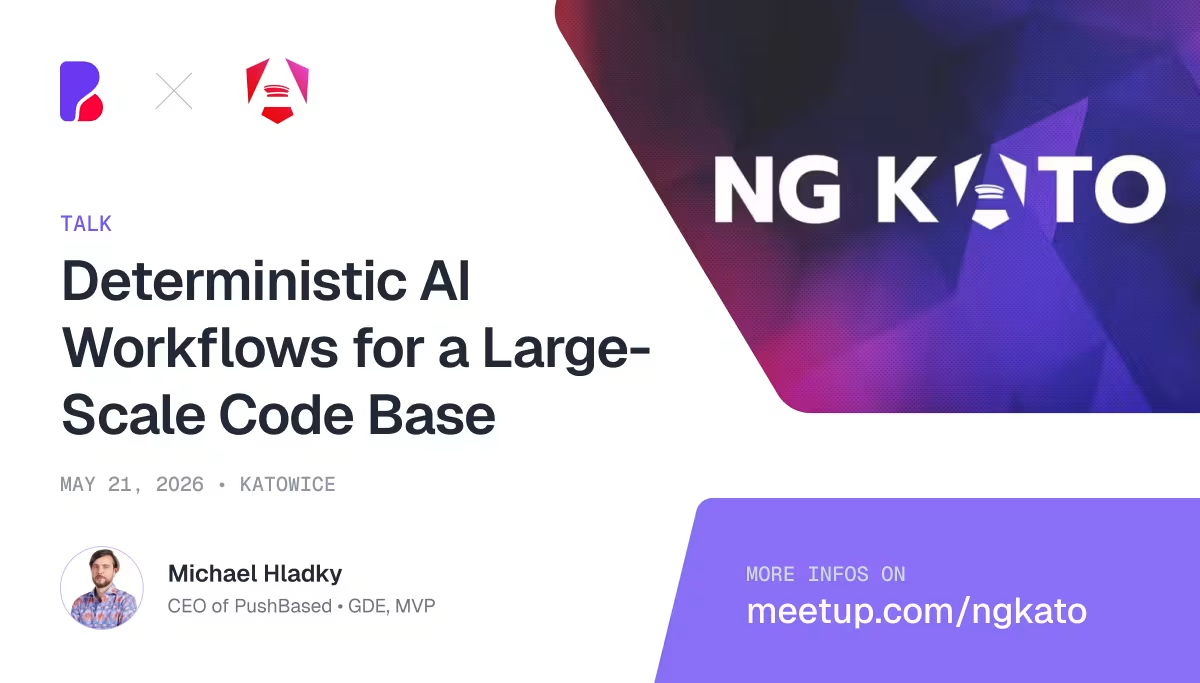
Deterministic AI Workflows for a Large-Scale Code Base | Michael Hladky @ ngKato
ngKato
May 21, 2026 · Katowice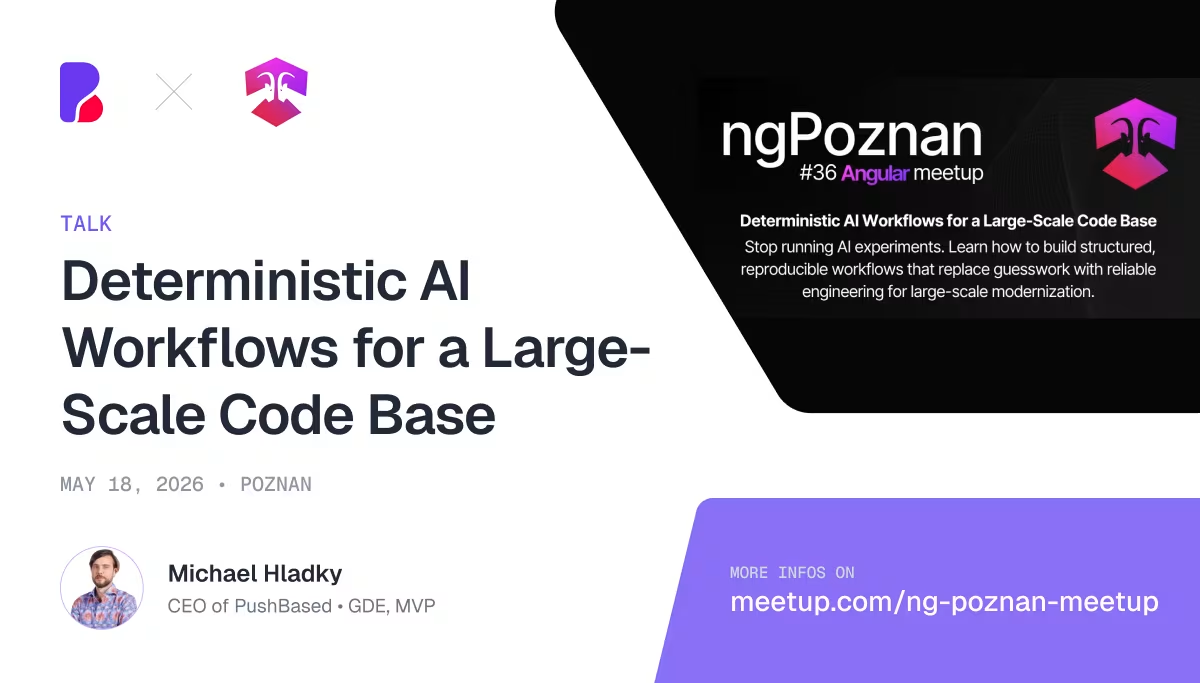
Deterministic AI Workflows for a Large-Scale Code Base | Michael Hladky @ ngPoznan

ngPoznan
May 18, 2026 · Poznan
Deterministic AI Workflows for a Large-Scale Code Base | Michael Hladky @ Angular Wroclaw
Angular Wroclaw
May 14, 2026 · Wroclaw
Analyze the JS Heap and Detect Memory Leaks | Julian Jandl @ NG Belgrade

NG Belgrade
May 7, 2026 · Cineplexx BIG, Belgrade
Moving legacy with AI | Michael Hladky @ AI India
